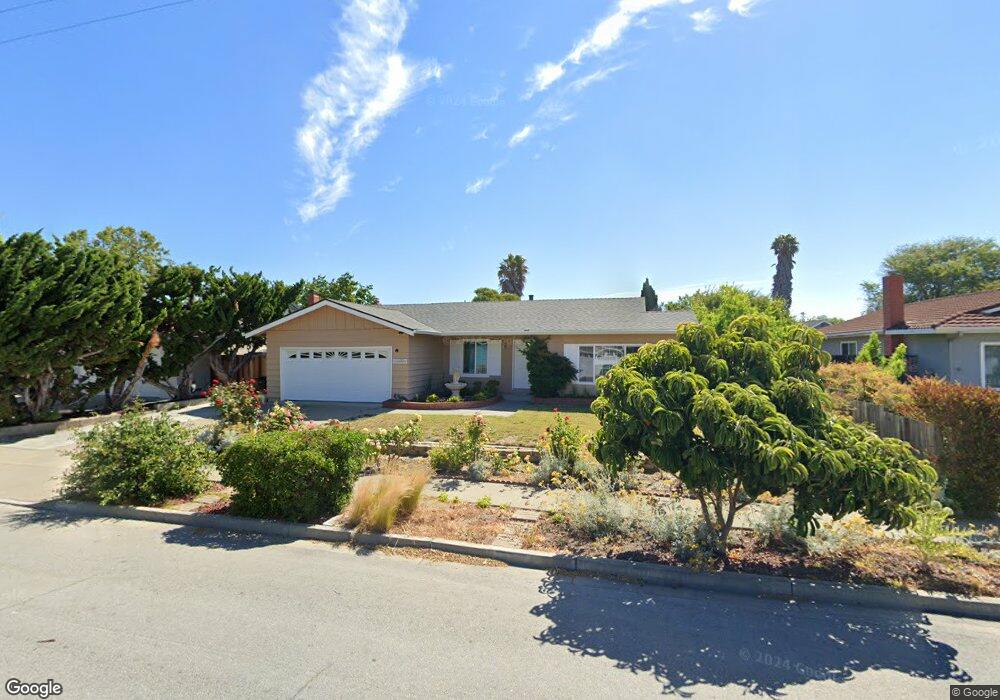
36026 Burning Tree Dr Newark, CA 94560
Estimated Value: $1,295,000 - $1,434,893
4
Beds
2
Baths
1,606
Sq Ft
$856/Sq Ft
Est. Value
About This Home
This home is located at 36026 Burning Tree Dr, Newark, CA 94560 and is currently estimated at $1,374,223, approximately $855 per square foot. 36026 Burning Tree Dr is a home located in Alameda County with nearby schools including Lincoln Elementary School, Newark Junior High School, and Newark Memorial High School.
Ownership History
Date
Name
Owned For
Owner Type
Purchase Details
Closed on
Jan 3, 2011
Sold by
To Lanh My
Bought by
To Lanh My and Lanh My To Revocable Trust
Current Estimated Value
Purchase Details
Closed on
May 5, 2009
Sold by
To Lanh My and Vanto Duc Van
Bought by
To Lanh My
Purchase Details
Closed on
Mar 1, 2002
Sold by
To Lanh My and To Linh My
Bought by
To Duc and To Lanh My
Home Financials for this Owner
Home Financials are based on the most recent Mortgage that was taken out on this home.
Original Mortgage
$166,000
Interest Rate
6.99%
Purchase Details
Closed on
Jun 4, 1998
Sold by
Mccrorey Lloyd M and Clark Jacquelyn E
Bought by
To Lanh My and To Linh My
Home Financials for this Owner
Home Financials are based on the most recent Mortgage that was taken out on this home.
Original Mortgage
$180,000
Interest Rate
7.11%
Create a Home Valuation Report for This Property
The Home Valuation Report is an in-depth analysis detailing your home's value as well as a comparison with similar homes in the area
Home Values in the Area
Average Home Value in this Area
Purchase History
| Date | Buyer | Sale Price | Title Company |
|---|---|---|---|
| To Lanh My | -- | None Available | |
| To Lanh My | $168,000 | None Available | |
| To Duc | $83,000 | Alliance Title Company | |
| To Lanh My | $260,000 | Fidelity National Title Co |
Source: Public Records
Mortgage History
| Date | Status | Borrower | Loan Amount |
|---|---|---|---|
| Closed | To Duc | $166,000 | |
| Closed | To Lanh My | $180,000 |
Source: Public Records
Tax History
| Year | Tax Paid | Tax Assessment Tax Assessment Total Assessment is a certain percentage of the fair market value that is determined by local assessors to be the total taxable value of land and additions on the property. | Land | Improvement |
|---|---|---|---|---|
| 2025 | $6,307 | $490,926 | $148,905 | $349,021 |
| 2024 | $6,307 | $481,165 | $145,986 | $342,179 |
| 2023 | $6,128 | $478,595 | $143,124 | $335,471 |
| 2022 | $6,040 | $462,212 | $140,318 | $328,894 |
| 2021 | $5,890 | $453,013 | $137,567 | $322,446 |
| 2020 | $5,784 | $455,298 | $136,157 | $319,141 |
| 2019 | $5,702 | $446,373 | $133,488 | $312,885 |
| 2018 | $5,614 | $437,622 | $130,871 | $306,751 |
| 2017 | $5,470 | $429,042 | $128,305 | $300,737 |
| 2016 | $5,408 | $420,632 | $125,790 | $294,842 |
| 2015 | $5,389 | $414,316 | $123,901 | $290,415 |
| 2014 | $5,240 | $406,203 | $121,475 | $284,728 |
Source: Public Records
Map
Nearby Homes
- 35760 Haley St
- 6988 Jarvis Ave
- 36184 Toulouse St
- 8093 Del Monte Ave
- 36347 Colbert Place
- 36671 Ponderosa Ct
- 36569 Beutke Dr
- 36563 Beutke Dr
- 35442 Breton Dr
- 35088 Lido Blvd Unit K
- 36923 Walnut St
- 36871 Locust St
- 36985 Walnut St
- 37052 Poplar St
- 6328 Zulmida Ave
- 6417/6433 Thornton Ave
- 37054 Locust St Unit ABC
- 7843 Railroad Ave
- 6190 Bellhaven Place
- 35926 Newark Blvd
- 36040 Burning Tree Dr
- 36012 Burning Tree Dr
- 36031 Bettencourt St
- 36017 Bettencourt St
- 36052 Burning Tree Dr
- 35994 Burning Tree Dr
- 36043 Bettencourt St
- 36031 Burning Tree Dr
- 7622 Inverness Dr
- 36005 Bettencourt St
- 36049 Burning Tree Dr
- 36066 Burning Tree Dr
- 35982 Burning Tree Dr
- 7659 Crestmont Ave
- 7613 Crestmont Ave
- 35993 Bettencourt St
- 7791 Arrowhead Place
- 35991 Burning Tree Dr
- 7654 Inverness Dr
- 36082 Burning Tree Dr
Your Personal Tour Guide
Ask me questions while you tour the home.