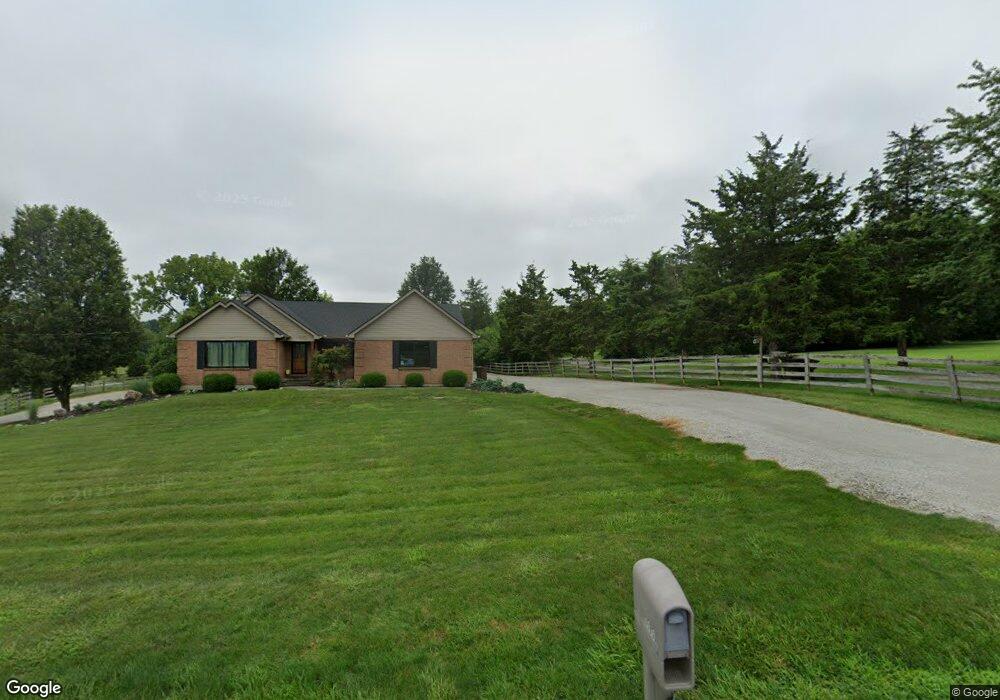
3603 Beal Rd Franklin, OH 45005
Estimated Value: $372,000 - $537,721
3
Beds
3
Baths
2,526
Sq Ft
$170/Sq Ft
Est. Value
About This Home
This home is located at 3603 Beal Rd, Franklin, OH 45005 and is currently estimated at $428,680, approximately $169 per square foot. 3603 Beal Rd is a home located in Warren County with nearby schools including Franklin High School and The CinDay Academy.
Ownership History
Date
Name
Owned For
Owner Type
Purchase Details
Closed on
Aug 10, 2017
Sold by
Foster Pietra
Bought by
Foster Pietra
Current Estimated Value
Purchase Details
Closed on
Jun 20, 1983
Sold by
Mauritz Saron and Mauritz Saron
Bought by
Nickerson and Nickerson Wilse E
Purchase Details
Closed on
Mar 4, 1980
Sold by
Mauritz Mauritz and Mauritz Peter O
Create a Home Valuation Report for This Property
The Home Valuation Report is an in-depth analysis detailing your home's value as well as a comparison with similar homes in the area
Home Values in the Area
Average Home Value in this Area
Purchase History
| Date | Buyer | Sale Price | Title Company |
|---|---|---|---|
| Foster Pietra | -- | -- | |
| Nickerson | $115,000 | -- | |
| -- | -- | -- |
Source: Public Records
Tax History
| Year | Tax Paid | Tax Assessment Tax Assessment Total Assessment is a certain percentage of the fair market value that is determined by local assessors to be the total taxable value of land and additions on the property. | Land | Improvement |
|---|---|---|---|---|
| 2025 | $6,374 | $144,010 | $64,830 | $79,180 |
| 2024 | $6,374 | $144,010 | $64,830 | $79,180 |
| 2023 | $5,494 | $111,881 | $41,433 | $70,448 |
| 2022 | $5,376 | $111,881 | $41,433 | $70,448 |
| 2021 | $5,075 | $111,881 | $41,433 | $70,448 |
| 2020 | $4,689 | $90,958 | $33,684 | $57,274 |
| 2019 | $4,236 | $90,958 | $33,684 | $57,274 |
| 2018 | $4,243 | $90,958 | $33,684 | $57,274 |
| 2017 | $4,458 | $85,547 | $30,709 | $54,838 |
| 2016 | $4,554 | $85,547 | $30,709 | $54,838 |
| 2015 | $4,025 | $85,547 | $30,709 | $54,838 |
| 2014 | -- | $79,160 | $29,750 | $49,400 |
| 2013 | $3,226 | $91,350 | $31,580 | $59,770 |
Source: Public Records
Map
Nearby Homes
- 6 Beal Rd
- 3574 Mclean Rd
- 4100 Beal Rd
- 5604 Ohio 123
- 5604 State Route 123
- 31 Sprucewood Ct
- 5265 Robinson Vail Rd
- 29 Louise Dr
- 6510 State Route 123
- 6510 Ohio 123
- 5291 Weidner Rd
- 45 Libby Hollow St
- 79 Glasgow St
- 79 Glasgow St Unit 40
- 45 Copperhead Trail
- 25 Copperhead Trail
- 995 E 4th St
- 25 Morris St
- 25 Morris St Unit 13
- 45 Marisha Ct
Your Personal Tour Guide
Ask me questions while you tour the home.