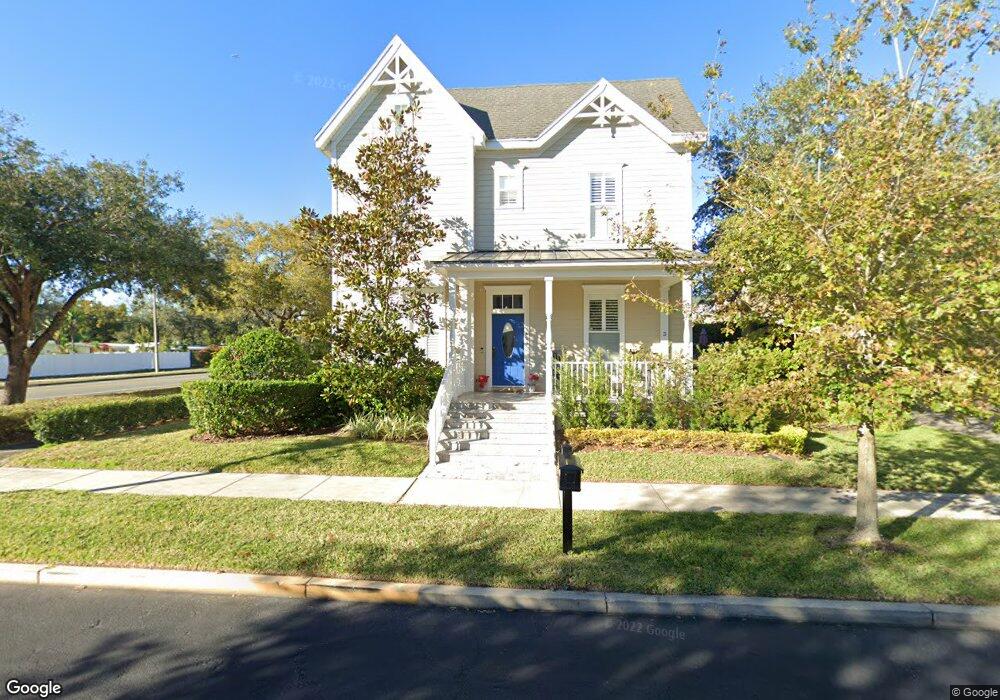
3603 Lower Union Rd Orlando, FL 32814
Baldwin Park NeighborhoodEstimated Value: $1,055,000 - $1,777,000
3
Beds
3
Baths
4,488
Sq Ft
$349/Sq Ft
Est. Value
About This Home
This home is located at 3603 Lower Union Rd, Orlando, FL 32814 and is currently estimated at $1,564,291, approximately $348 per square foot. 3603 Lower Union Rd is a home located in Orange County with nearby schools including Baldwin Park Elementary, Glenridge Middle, and Winter Park High.
Ownership History
Date
Name
Owned For
Owner Type
Purchase Details
Closed on
Nov 24, 2008
Sold by
American Home Mortgage Servicing Inc
Bought by
Townsend Frank M and Townsend Cindy A
Current Estimated Value
Purchase Details
Closed on
Nov 13, 2008
Sold by
Ahmsi Default Services Inc
Bought by
Townsend Frank M and Townsend Cindy A
Purchase Details
Closed on
Mar 31, 2008
Sold by
American Home Mortgage Servicing Inc
Bought by
Ahmsi Default Services Inc
Purchase Details
Closed on
Oct 23, 2007
Sold by
Jeffcoat Jack
Bought by
American Home Mortgage Servicing Inc
Purchase Details
Closed on
Mar 28, 2006
Sold by
Weekley Homes Lp
Bought by
Jeffcoat Jack and Jeffcoat Mary
Home Financials for this Owner
Home Financials are based on the most recent Mortgage that was taken out on this home.
Original Mortgage
$88,076
Interest Rate
6.2%
Mortgage Type
Stand Alone Second
Create a Home Valuation Report for This Property
The Home Valuation Report is an in-depth analysis detailing your home's value as well as a comparison with similar homes in the area
Home Values in the Area
Average Home Value in this Area
Purchase History
| Date | Buyer | Sale Price | Title Company |
|---|---|---|---|
| Townsend Frank M | $325,500 | Attorney | |
| Townsend Frank M | -- | Attorney | |
| Ahmsi Default Services Inc | -- | None Available | |
| American Home Mortgage Servicing Inc | -- | Attorney | |
| Jeffcoat Jack | $440,400 | Multiple |
Source: Public Records
Mortgage History
| Date | Status | Borrower | Loan Amount |
|---|---|---|---|
| Previous Owner | Jeffcoat Jack | $88,076 | |
| Previous Owner | Jeffcoat Jack | $352,305 |
Source: Public Records
Tax History Compared to Growth
Tax History
| Year | Tax Paid | Tax Assessment Tax Assessment Total Assessment is a certain percentage of the fair market value that is determined by local assessors to be the total taxable value of land and additions on the property. | Land | Improvement |
|---|---|---|---|---|
| 2025 | $13,282 | $677,137 | -- | -- |
| 2024 | $12,661 | $677,137 | -- | -- |
| 2023 | $12,661 | $638,886 | $0 | $0 |
| 2022 | $12,359 | $620,278 | $0 | $0 |
| 2021 | $12,157 | $602,212 | $0 | $0 |
| 2020 | $11,595 | $593,897 | $0 | $0 |
| 2019 | $11,977 | $580,544 | $0 | $0 |
| 2018 | $11,885 | $569,719 | $0 | $0 |
| 2017 | $11,844 | $750,836 | $109,000 | $641,836 |
| 2016 | $6,029 | $408,113 | $109,000 | $299,113 |
| 2015 | $6,089 | $383,296 | $109,000 | $274,296 |
| 2014 | $6,109 | $368,884 | $109,000 | $259,884 |
Source: Public Records
Map
Nearby Homes
- 3704 Lower Union Rd
- 3632 Upper Union Rd
- 2098 Osprey Ave
- 2128 Sycamore Dr
- 3838 Haws Ln
- 3856 Haws Ln
- 2001 Shaw Ln
- 3600 Ethan Ln
- 2260 Mulbry Dr
- 2825 Mulford Ave
- 3929 Corrine Dr
- 2308 Mulbry Dr
- 2812 Woodside Ave
- 4001 Corrine Dr
- 3626 Bobolink Ln
- 2823 Wright Ave
- 1616 Oriole Ave
- 2614 Parkland Dr
- 2129 Fosgate Dr
- 1201 Tanager Dr
- 2025 Biddle Alley
- 2001 Biddle Alley
- 2049 Biddle Alley
- 3602 Derran Ln
- 3602 Derran Ln Unit 4
- 2406 Winter Park Rd
- 2073 Biddle Alley
- 2097 Biddle Alley
- 3624 Lower Union Rd Unit 4
- 3624 Lower Union Rd
- 3600 Lower Union Rd Unit 4
- 3648 Lower Union Rd
- 3650 Lower Union Rd Unit 4
- 3650 Lower Union Rd
- 3018 Northwood Blvd
- 3024 Northwood Blvd
- 3656 Lower Union Rd
- 3662 Road
- 3662 Lower Union Rd
- 3662 Lower Union Rd Unit 4