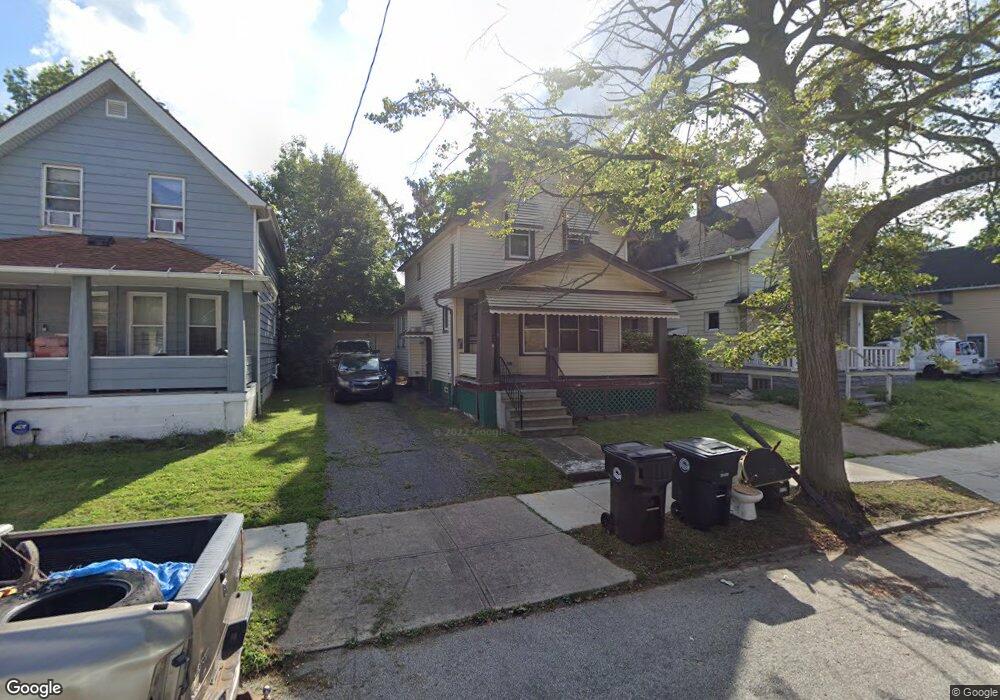
3605 E 105th St Cleveland, OH 44105
Union-Miles Park NeighborhoodEstimated Value: $83,000 - $98,000
3
Beds
1
Bath
895
Sq Ft
$103/Sq Ft
Est. Value
About This Home
This home is located at 3605 E 105th St, Cleveland, OH 44105 and is currently estimated at $92,416, approximately $103 per square foot. 3605 E 105th St is a home located in Cuyahoga County with nearby schools including Village Preparatory Academy: Woodland Hills Campus.
Ownership History
Date
Name
Owned For
Owner Type
Purchase Details
Closed on
Oct 14, 2025
Sold by
Sold Simple Property Solutions Llc
Bought by
Ohio S8 Llc
Current Estimated Value
Home Financials for this Owner
Home Financials are based on the most recent Mortgage that was taken out on this home.
Original Mortgage
$74,000
Outstanding Balance
$74,000
Interest Rate
6.5%
Mortgage Type
New Conventional
Estimated Equity
$18,416
Purchase Details
Closed on
May 30, 2025
Sold by
Harrison Jason
Bought by
Sold Simple Property Solutions Llc
Home Financials for this Owner
Home Financials are based on the most recent Mortgage that was taken out on this home.
Original Mortgage
$40,750
Interest Rate
6.83%
Mortgage Type
New Conventional
Purchase Details
Closed on
Mar 18, 2025
Sold by
West Tracie E and West Tyrone
Bought by
Harrison Jason
Purchase Details
Closed on
Jan 10, 1989
Sold by
Goda Davey
Bought by
West Phanon M
Purchase Details
Closed on
May 7, 1987
Bought by
Goda Davey
Purchase Details
Closed on
Jan 27, 1987
Sold by
Nolan John R
Bought by
Secy Of H U D
Purchase Details
Closed on
Jan 11, 1984
Sold by
Charlotte Williams
Bought by
Nolan John R
Purchase Details
Closed on
Aug 21, 1979
Sold by
Williams John and Williams Charlotte
Bought by
Charlotte Williams
Purchase Details
Closed on
Jan 1, 1975
Bought by
Williams John and Williams Charlotte
Create a Home Valuation Report for This Property
The Home Valuation Report is an in-depth analysis detailing your home's value as well as a comparison with similar homes in the area
Home Values in the Area
Average Home Value in this Area
Purchase History
| Date | Buyer | Sale Price | Title Company |
|---|---|---|---|
| Ohio S8 Llc | $92,500 | Empora Title | |
| Sold Simple Property Solutions Llc | $35,000 | Empora Title Llc | |
| Harrison Jason | $13,276 | None Listed On Document | |
| West Phanon M | $32,000 | -- | |
| Goda Davey | -- | -- | |
| Secy Of H U D | -- | -- | |
| Nolan John R | $22,900 | -- | |
| Charlotte Williams | -- | -- | |
| Williams John | -- | -- |
Source: Public Records
Mortgage History
| Date | Status | Borrower | Loan Amount |
|---|---|---|---|
| Open | Ohio S8 Llc | $74,000 | |
| Previous Owner | Sold Simple Property Solutions Llc | $40,750 |
Source: Public Records
Tax History
| Year | Tax Paid | Tax Assessment Tax Assessment Total Assessment is a certain percentage of the fair market value that is determined by local assessors to be the total taxable value of land and additions on the property. | Land | Improvement |
|---|---|---|---|---|
| 2024 | $983 | $14,980 | $2,625 | $12,355 |
| 2023 | $709 | $9,350 | $1,720 | $7,630 |
| 2022 | $705 | $9,345 | $1,715 | $7,630 |
| 2021 | $698 | $9,350 | $1,720 | $7,630 |
| 2020 | $695 | $8,050 | $1,470 | $6,580 |
| 2019 | $643 | $23,000 | $4,200 | $18,800 |
| 2018 | $641 | $8,050 | $1,470 | $6,580 |
| 2017 | $794 | $9,630 | $1,330 | $8,300 |
| 2016 | $788 | $9,630 | $1,330 | $8,300 |
| 2015 | $929 | $9,630 | $1,330 | $8,300 |
| 2014 | $929 | $11,310 | $1,580 | $9,730 |
Source: Public Records
Map
Nearby Homes
- 3592 E 106th St
- 3591 E 104th St
- 3611 E 103rd St
- 3566 E 108th St
- 3659 E 104th St
- 3542 E 108th St
- 3531 E 104th St
- 3552 E 110th St
- 3684 E 106th St
- 3544 E 110th St
- 3540 E 110th St
- 3525 E 110th St
- 3486 E 105th St
- 3513 E 110th St
- 3582 E 112th St
- 3457 E 105th St
- 9714 Orleans Ave
- 3452 E 104th St
- 9814 Dunlap Ave
- 3669 E 112th St
- 3601 E 105th St
- 3609 E 105th St
- 3597 E 105th St
- 3611 E 105th St
- 3615 E 105th St
- 3604 E 106th St
- 3593 E 105th St
- 3600 E 106th St
- 3608 E 106th St
- 3596 E 106th St
- 3604 E 105th St
- 3608 E 105th St
- 3600 E 105th St
- 3591 E 105th St
- 3612 E 106th St
- 3610 E 105th St
- 3596 E 105th St
- 3616 E 106th St Unit Down 1
- 3614 E 105th St
- 3592 E 105th St
Your Personal Tour Guide
Ask me questions while you tour the home.