3605 Stiving Rd Shelby, OH 44875
Estimated Value: $211,000 - $297,000
3
Beds
2
Baths
1,602
Sq Ft
$156/Sq Ft
Est. Value
About This Home
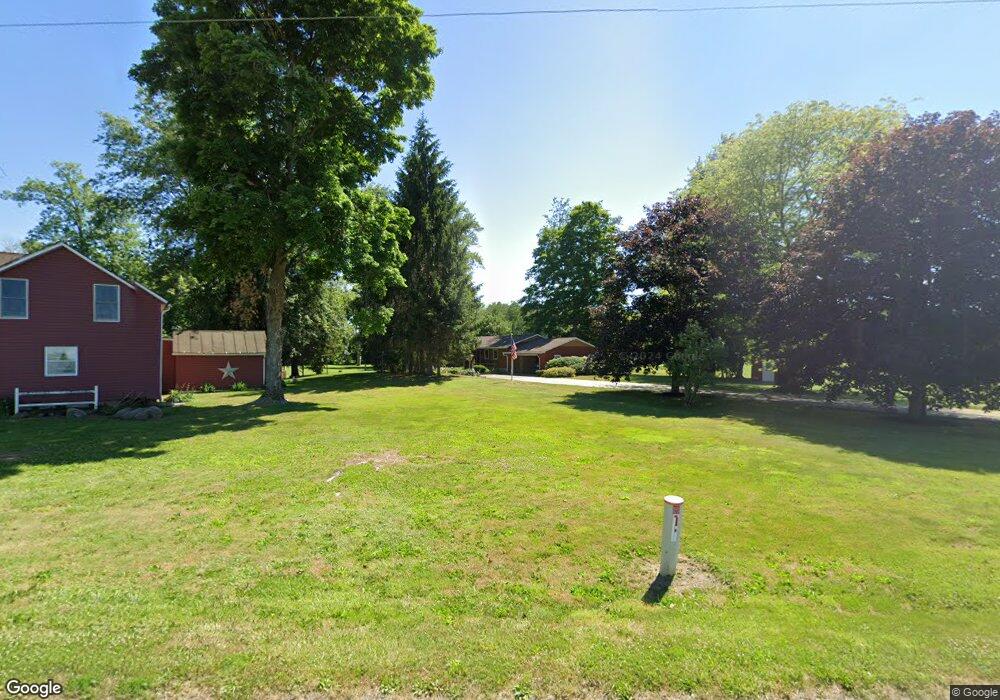
This home is located at 3605 Stiving Rd, Shelby, OH 44875 and is currently estimated at $250,220, approximately $156 per square foot. 3605 Stiving Rd is a home located in Richland County.
Ownership History
Date
Name
Owned For
Owner Type
Purchase Details
Closed on
Aug 9, 2024
Sold by
Kaple Jan E and Kaple Barbara A
Bought by
Kaple Jan E and Kaple Barbara A
Current Estimated Value
Create a Home Valuation Report for This Property
The Home Valuation Report is an in-depth analysis detailing your home's value as well as a comparison with similar homes in the area
Purchase History
| Date | Buyer | Sale Price | Title Company |
|---|---|---|---|
| Kaple Jan E | -- | Southern Title | |
| Kaple Jan E | -- | Southern Title | |
| Myers Nicole S | $12,050 | Southern Title | |
| Myers Nicole S | $12,050 | Southern Title | |
| Kaple Jan E | -- | Southern Title | |
| Kaple Jan E | -- | Southern Title |
Source: Public Records
Tax History
| Year | Tax Paid | Tax Assessment Tax Assessment Total Assessment is a certain percentage of the fair market value that is determined by local assessors to be the total taxable value of land and additions on the property. | Land | Improvement |
|---|---|---|---|---|
| 2024 | $1,647 | $54,860 | $9,390 | $45,470 |
| 2023 | $1,710 | $58,620 | $12,770 | $45,850 |
| 2022 | $1,788 | $50,650 | $12,340 | $38,310 |
| 2021 | $1,789 | $50,650 | $12,340 | $38,310 |
| 2020 | $1,790 | $50,650 | $12,340 | $38,310 |
| 2019 | $1,597 | $43,160 | $10,460 | $32,700 |
| 2018 | $1,565 | $43,160 | $10,460 | $32,700 |
| 2017 | $1,585 | $43,160 | $10,460 | $32,700 |
| 2016 | $1,619 | $45,050 | $9,410 | $35,640 |
| 2015 | $1,619 | $45,050 | $9,410 | $35,640 |
| 2014 | $1,554 | $45,050 | $9,410 | $35,640 |
| 2012 | $1,537 | $45,050 | $9,410 | $35,640 |
Source: Public Records
Map
Nearby Homes
- 3566 Stein Rd
- 3062 Myers Rd
- 3400 Rock Rd
- 671 Bendle Ave
- 0 Rock Rd
- 572 Bendle Ave
- 3767 Cookton Grange Rd
- 2690 Taylortown Rd
- 1689 Ohio 314
- 1689 State Route 314
- 67 Sherman Ave
- 14 W Maxwell Dr
- 23 W Gaylord Ave
- 76 Mansfield Ave
- 62 Renfrew Dr
- 21 Franklin Ave
- 47 Roberts Dr
- 65 Parkwood Dr
- 68 Walnut St
- 226 E Main St
- 3591 Stiving Rd
- 3676 Stein Rd
- 3586 Stiving Rd
- 3535 Stiving Rd
- 3526 Stiving Rd
- 3516 Stiving Rd
- 3749 Stiving Rd
- 3515 Stiving Rd
- 3576 Stein Rd
- 3503 Stiving Rd
- 3492 Stiving Rd
- 3479 Stiving Rd
- 3465 Stiving Rd
- 3566 Stine Rd
- 3538 Stein Rd
- 3530 Stein Rd
- 3522 Stein Rd
- 3599 Stein Rd
- 2954 State Route 314
- 3449 Stiving Rd
Your Personal Tour Guide
Ask me questions while you tour the home.