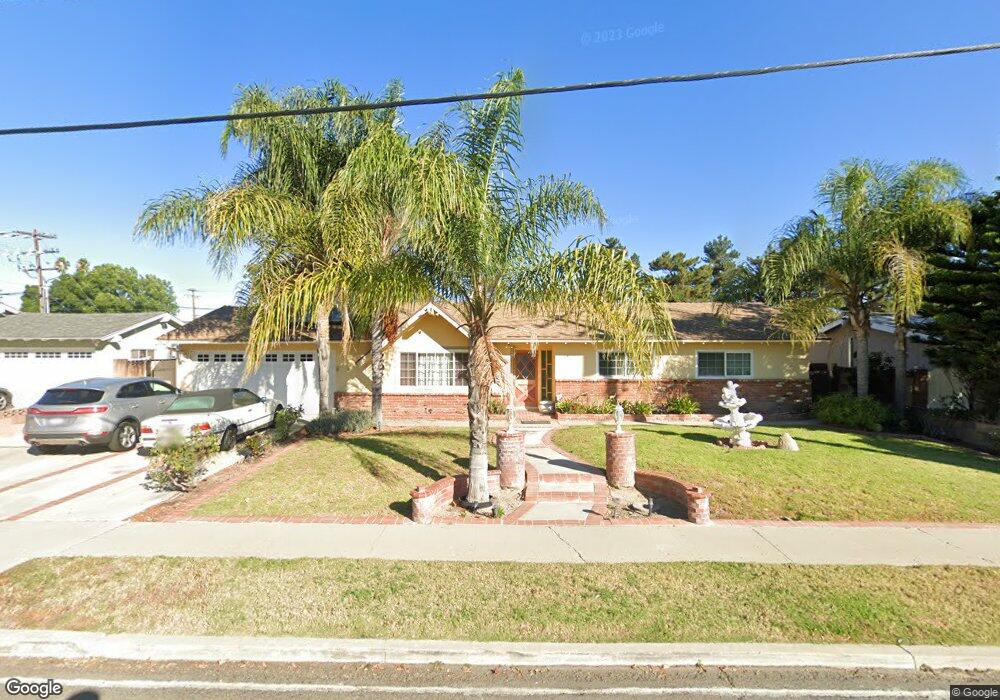
3607 Semple St Simi Valley, CA 93063
Central Simi Valley NeighborhoodEstimated Value: $714,000 - $782,000
3
Beds
2
Baths
1,233
Sq Ft
$607/Sq Ft
Est. Value
About This Home
This home is located at 3607 Semple St, Simi Valley, CA 93063 and is currently estimated at $748,003, approximately $606 per square foot. 3607 Semple St is a home located in Ventura County with nearby schools including Mountain View Elementary School, Hillside Middle School, and Simi Valley High School.
Ownership History
Date
Name
Owned For
Owner Type
Purchase Details
Closed on
Feb 14, 2005
Sold by
Bustamante Rodolfo Marcelo
Bought by
Bustamante Alma
Current Estimated Value
Home Financials for this Owner
Home Financials are based on the most recent Mortgage that was taken out on this home.
Original Mortgage
$283,500
Outstanding Balance
$143,909
Interest Rate
5.73%
Mortgage Type
New Conventional
Estimated Equity
$604,094
Purchase Details
Closed on
Oct 2, 2001
Sold by
Bustamante Rodolfo Marcelo
Bought by
Bustamante Rodolfo Marcelo and Bustamante Alma J
Purchase Details
Closed on
Nov 4, 1994
Sold by
Stallings Jim and Stallings Terri
Bought by
Hachtel Deborah A
Home Financials for this Owner
Home Financials are based on the most recent Mortgage that was taken out on this home.
Original Mortgage
$91,000
Interest Rate
9.25%
Create a Home Valuation Report for This Property
The Home Valuation Report is an in-depth analysis detailing your home's value as well as a comparison with similar homes in the area
Home Values in the Area
Average Home Value in this Area
Purchase History
| Date | Buyer | Sale Price | Title Company |
|---|---|---|---|
| Bustamante Alma | -- | Chicago Title Co | |
| Bustamante Rodolfo Marcelo | -- | Chicago Title Co | |
| Hachtel Deborah A | $171,000 | Commonwealth Land Title Co |
Source: Public Records
Mortgage History
| Date | Status | Borrower | Loan Amount |
|---|---|---|---|
| Open | Bustamante Alma | $283,500 | |
| Previous Owner | Hachtel Deborah A | $91,000 | |
| Closed | Bustamante Alma | $26,000 |
Source: Public Records
Tax History
| Year | Tax Paid | Tax Assessment Tax Assessment Total Assessment is a certain percentage of the fair market value that is determined by local assessors to be the total taxable value of land and additions on the property. | Land | Improvement |
|---|---|---|---|---|
| 2025 | $3,572 | $265,743 | $106,294 | $159,449 |
| 2024 | $3,572 | $260,533 | $104,210 | $156,323 |
| 2023 | $3,356 | $255,425 | $102,167 | $153,258 |
| 2022 | $3,320 | $250,417 | $100,164 | $150,253 |
| 2021 | $3,276 | $245,507 | $98,200 | $147,307 |
| 2020 | $3,195 | $242,992 | $97,194 | $145,798 |
| 2019 | $3,046 | $238,229 | $95,289 | $142,940 |
| 2018 | $3,007 | $233,559 | $93,421 | $140,138 |
| 2017 | $2,929 | $228,981 | $91,590 | $137,391 |
| 2016 | $2,793 | $224,493 | $89,795 | $134,698 |
| 2015 | $2,723 | $221,124 | $88,448 | $132,676 |
| 2014 | $2,673 | $216,794 | $86,716 | $130,078 |
Source: Public Records
Map
Nearby Homes
- 1870 Burch Ave
- 1814 Glenview Ave
- 1648 Rocky River Ct
- 2197 Hurles Ave
- 1638 Olympic St
- 2216 Carlsbad Ct
- 3297 Elmore St
- 1421 Sequoia Ave
- 3998 Celia Ct
- 2268 Brentwood St
- 2282 Brentwood St
- 2433 Medina Ave
- 2362 Medina Ave
- 2358 Medina Ave
- 3550 Woodhaven St
- 3648 Woodhaven St
- 3918 Cochran St Unit 19
- 3585 Woodhaven St
- 3082 Galena Ave
- 3306 Darby St Unit 402
- 3621 Semple St
- 3593 Semple St
- 3581 Semple St
- 3635 Semple St
- 3606 Semple St
- 3620 Semple St
- 3592 Semple St
- 3634 Semple St
- 3580 Semple St
- 3647 Semple St
- 3607 Buffum St
- 3621 Buffum St
- 3593 Buffum St
- 3646 Semple St
- 3620 Rosalie St
- 3632 Rosalie St
- 3635 Buffum St
- 3581 Buffum St
- 1935 Barnes St
- 3612 Rosalie St