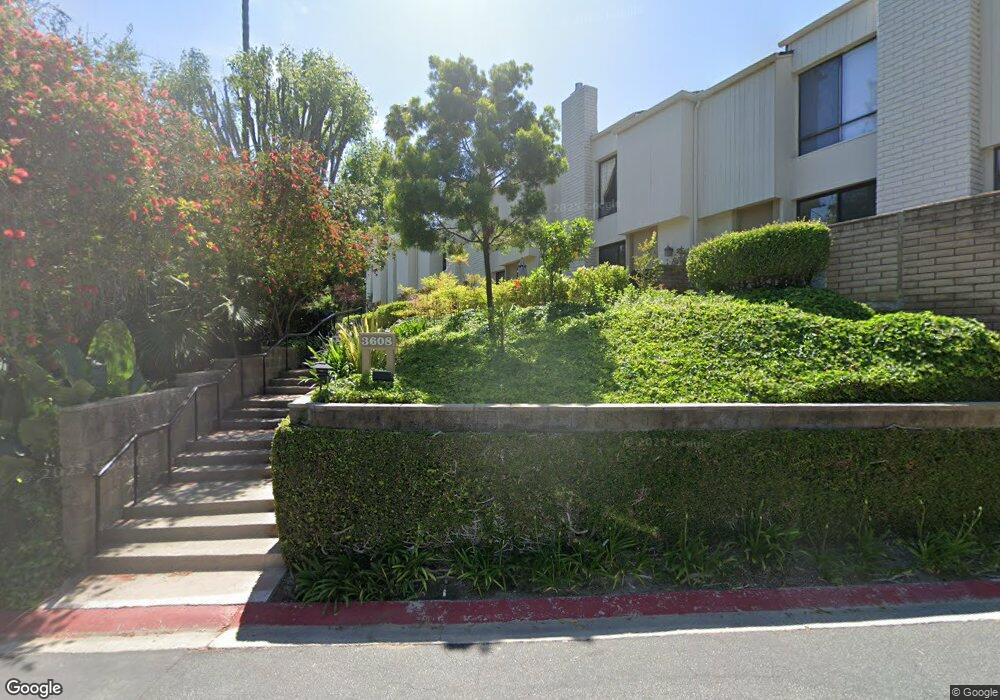
3608 W Estates Ln Unit C Rolling Hills Estates, CA 90274
Estimated Value: $964,000 - $1,659,000
3
Beds
3
Baths
1,722
Sq Ft
$688/Sq Ft
Est. Value
About This Home
This home is located at 3608 W Estates Ln Unit C, Rolling Hills Estates, CA 90274 and is currently estimated at $1,184,430, approximately $687 per square foot. 3608 W Estates Ln Unit C is a home located in Los Angeles County with nearby schools including Rancho Vista Elementary School, Miraleste Intermediate, and Palos Verdes Peninsula High School.
Ownership History
Date
Name
Owned For
Owner Type
Purchase Details
Closed on
Jul 9, 2019
Sold by
Bethel Raymond Gene and Bethel Takako
Bought by
Bethel Raymond Gene and Bethel Takako
Current Estimated Value
Home Financials for this Owner
Home Financials are based on the most recent Mortgage that was taken out on this home.
Original Mortgage
$120,000
Outstanding Balance
$105,131
Interest Rate
3.82%
Mortgage Type
New Conventional
Estimated Equity
$1,079,299
Purchase Details
Closed on
Sep 13, 2011
Sold by
Harrington Jean M
Bought by
Bethel Raymond Gene and Bethel Takako
Purchase Details
Closed on
Sep 2, 2011
Sold by
Bethel Radford G
Bought by
Bethel Linda K
Create a Home Valuation Report for This Property
The Home Valuation Report is an in-depth analysis detailing your home's value as well as a comparison with similar homes in the area
Home Values in the Area
Average Home Value in this Area
Purchase History
| Date | Buyer | Sale Price | Title Company |
|---|---|---|---|
| Bethel Raymond Gene | -- | Boston National Title | |
| Bethel Raymond Gene | $425,000 | Fidelity National Title Co | |
| Bethel Linda K | -- | Fidelity National Title Co |
Source: Public Records
Mortgage History
| Date | Status | Borrower | Loan Amount |
|---|---|---|---|
| Open | Bethel Raymond Gene | $120,000 |
Source: Public Records
Tax History
| Year | Tax Paid | Tax Assessment Tax Assessment Total Assessment is a certain percentage of the fair market value that is determined by local assessors to be the total taxable value of land and additions on the property. | Land | Improvement |
|---|---|---|---|---|
| 2025 | $6,577 | $533,809 | $222,314 | $311,495 |
| 2024 | $6,577 | $523,343 | $217,955 | $305,388 |
| 2023 | $6,481 | $513,082 | $213,682 | $299,400 |
| 2022 | $6,165 | $503,023 | $209,493 | $293,530 |
| 2021 | $6,713 | $548,744 | $230,793 | $317,951 |
| 2020 | $6,104 | $488,106 | $203,281 | $284,825 |
| 2019 | $5,930 | $478,537 | $199,296 | $279,241 |
| 2018 | $5,869 | $469,155 | $195,389 | $273,766 |
| 2016 | $5,563 | $450,939 | $187,802 | $263,137 |
| 2015 | $5,505 | $444,167 | $184,982 | $259,185 |
| 2014 | $5,436 | $435,467 | $181,359 | $254,108 |
Source: Public Records
Map
Nearby Homes
- 3601 W Fox Ridge Ln Unit A
- 3605 W Hidden Ln Unit 310
- 3605 W Hidden Ln Unit 309
- 3605 W Hidden Ln Unit 305
- 3604 W Estates Ln Unit 114
- 3601 W Hidden Ln Unit 121
- 3605 W Hidden Ln Unit 112
- 3603 W Hidden Ln Unit 317
- 3602 W Estates Ln Unit 306
- 2918 Briarwood Dr
- 2715 Grand Summit Rd
- 2642 Loftyview Dr
- 25710 Crest Rd
- 25601 Crenshaw Blvd
- 25932 Richville Dr
- 25246 Bigelow Rd
- 2806 Pacific Coast Hwy
- 2834 Pacific Coast Hwy
- 3241 Dalemead St
- 25535 Hawthorne Blvd
- 3608 W Estates Ln
- 3616 W Estates Ln
- 3608 W Estates Ln Unit F
- 3608 W Estates Ln Unit E
- 3608 W Estates Ln Unit D
- 3608 W Estates Ln Unit B
- 3603 W Fox Ridge Ln Unit A
- 3603 W Fox Ridge Ln Unit B
- 3603 W Fox Ridge Ln Unit C
- 3608 W Estates Ln Unit A
- 3603 W Fox Ridge Ln Unit D
- 3616 W Estates Ln Unit D
- 3616 W Estates Ln Unit C
- 3616 W Estates Ln Unit B
- 3616 W Estates Ln Unit A
- 3618 W Estates Ln Unit D
- 3618 W Estates Ln Unit C
- 3618 W Estates Ln Unit B
- 3618 W Estates Ln Unit A
- 3612 W Estates Ln Unit A
Your Personal Tour Guide
Ask me questions while you tour the home.