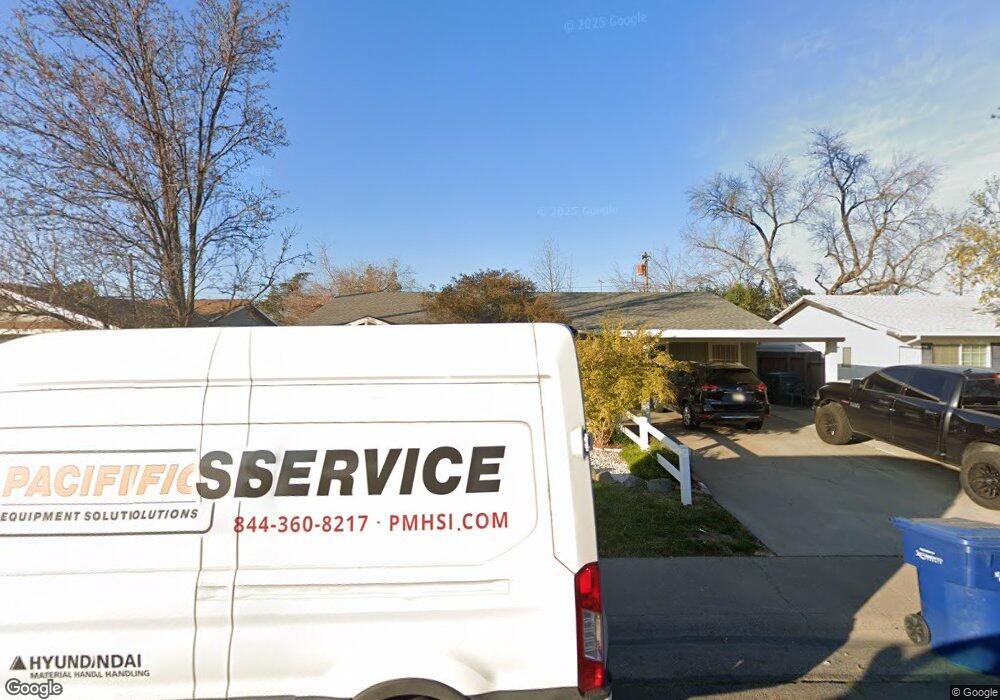
3609 Quinn Way North Highlands, CA 95660
Larchmont Village NeighborhoodEstimated Value: $415,000 - $459,000
3
Beds
2
Baths
1,501
Sq Ft
$286/Sq Ft
Est. Value
About This Home
This home is located at 3609 Quinn Way, North Highlands, CA 95660 and is currently estimated at $428,999, approximately $285 per square foot. 3609 Quinn Way is a home located in Sacramento County with nearby schools including Sierra View Elementary School, Highlands High School, and Creative Connections Arts Academy.
Ownership History
Date
Name
Owned For
Owner Type
Purchase Details
Closed on
May 28, 2024
Sold by
Starks Mary J
Bought by
Janie Starks Revocable Trust and Starks
Current Estimated Value
Purchase Details
Closed on
Mar 23, 2017
Sold by
Starks Mary Jane and The Janie Starks Revocable Tru
Bought by
Starks Mary J
Home Financials for this Owner
Home Financials are based on the most recent Mortgage that was taken out on this home.
Original Mortgage
$112,550
Interest Rate
4.16%
Mortgage Type
New Conventional
Purchase Details
Closed on
Apr 20, 2016
Sold by
Starks Mary Jane
Bought by
Starks Mary Jane and The Janie Starks Revocable Tru
Purchase Details
Closed on
Jul 2, 2001
Sold by
Moore Charles A and Moore Teressa A
Bought by
Starks Mary J
Home Financials for this Owner
Home Financials are based on the most recent Mortgage that was taken out on this home.
Original Mortgage
$134,598
Interest Rate
7.26%
Mortgage Type
FHA
Create a Home Valuation Report for This Property
The Home Valuation Report is an in-depth analysis detailing your home's value as well as a comparison with similar homes in the area
Home Values in the Area
Average Home Value in this Area
Purchase History
| Date | Buyer | Sale Price | Title Company |
|---|---|---|---|
| Janie Starks Revocable Trust | -- | None Listed On Document | |
| Starks Mary J | -- | First American Title Company | |
| Starks Mary Jane | -- | None Available | |
| Starks Mary J | $136,500 | Placer Title Company |
Source: Public Records
Mortgage History
| Date | Status | Borrower | Loan Amount |
|---|---|---|---|
| Previous Owner | Starks Mary J | $112,550 | |
| Previous Owner | Starks Mary J | $134,598 | |
| Closed | Starks Mary J | $5,000 |
Source: Public Records
Tax History Compared to Growth
Tax History
| Year | Tax Paid | Tax Assessment Tax Assessment Total Assessment is a certain percentage of the fair market value that is determined by local assessors to be the total taxable value of land and additions on the property. | Land | Improvement |
|---|---|---|---|---|
| 2025 | $2,161 | $198,817 | $36,921 | $161,896 |
| 2024 | $2,161 | $194,920 | $36,198 | $158,722 |
| 2023 | $2,175 | $191,099 | $35,489 | $155,610 |
| 2022 | $2,045 | $187,353 | $34,794 | $152,559 |
| 2021 | $2,038 | $183,680 | $34,112 | $149,568 |
| 2020 | $2,019 | $181,798 | $33,763 | $148,035 |
| 2019 | $1,991 | $178,234 | $33,101 | $145,133 |
| 2018 | $1,890 | $174,740 | $32,452 | $142,288 |
| 2017 | $1,937 | $171,315 | $31,816 | $139,499 |
| 2016 | $1,936 | $167,957 | $31,193 | $136,764 |
| 2015 | $1,818 | $165,435 | $30,725 | $134,710 |
| 2014 | $1,853 | $162,196 | $30,124 | $132,072 |
Source: Public Records
Map
Nearby Homes
- 3627 Mc Cain Way
- 7235 Watt Ave
- 7101 Thomas Dr
- 7125 Larchmont Dr
- 3748 Arroyo Seco Ln Unit 22
- 7500 Costa Mesa Cir Unit 135
- 3725 Arroyo Seco Ln Unit 75
- 3553 Caballero Ln
- 7232 Antelope Woods Way
- 7648 Lily Mar Ln
- 3931 Ramsey Dr
- 3523 Scotland Dr
- 4006 Cortright Way
- 3319 U St
- 7016 32nd St
- 0 Elkhorn Unit 225074516
- 4234 N Country Dr
- 6700 Cantel Way
- 4104 Crumley Way
- 3101 U St
- 3613 Quinn Way
- 3605 Quinn Way
- 3601 Quinn Way
- 3617 Quinn Way
- 3604 Winthrop Ct
- 3608 Quinn Way
- 3616 Winthrop Ct
- 3612 Quinn Way
- 3600 Quinn Way
- 3619 Quinn Way
- 3616 Quinn Way
- 3620 Winthrop Ct
- 3618 Quinn Way
- 3600 Winthrop Ct
- 3621 Quinn Way
- 3605 Bainbridge Dr
- 3624 Winthrop Ct
- 3609 Bainbridge Dr
- 3601 Bainbridge Dr
- 3613 Bainbridge Dr