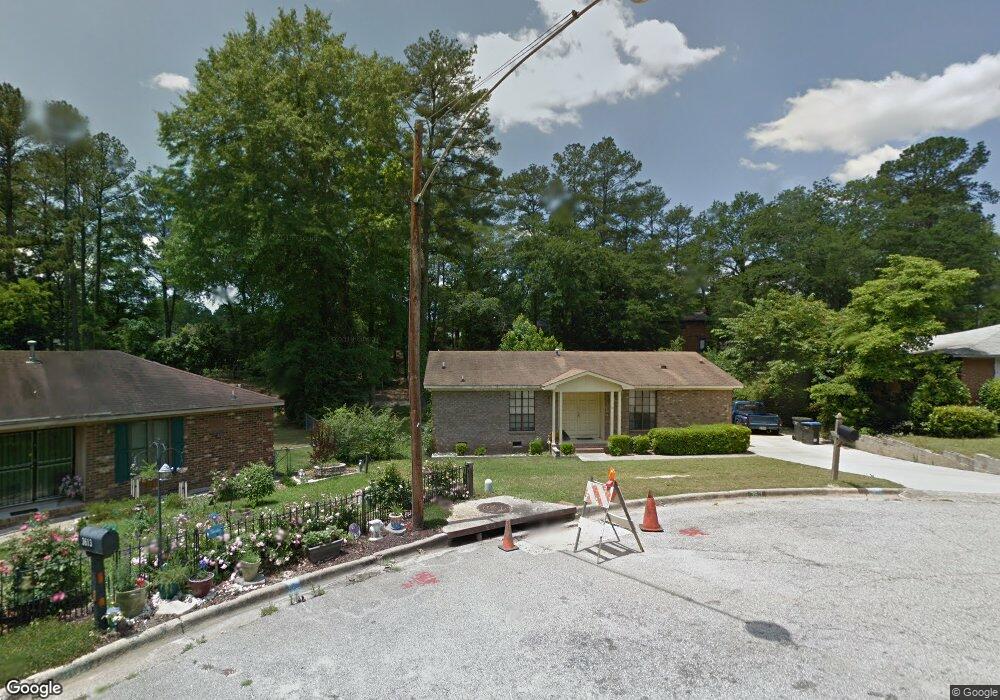
3611 Concord Ct Augusta, GA 30906
Southside NeighborhoodEstimated Value: $134,000 - $152,810
3
Beds
2
Baths
1,153
Sq Ft
$127/Sq Ft
Est. Value
About This Home
This home is located at 3611 Concord Ct, Augusta, GA 30906 and is currently estimated at $146,453, approximately $127 per square foot. 3611 Concord Ct is a home located in Richmond County with nearby schools including Richmond Hill K-8, Johnson Magnet, and Butler High School.
Ownership History
Date
Name
Owned For
Owner Type
Purchase Details
Closed on
Oct 3, 1996
Sold by
James Jacqueline
Bought by
Patterson Cheryl Ann
Current Estimated Value
Purchase Details
Closed on
Sep 14, 1996
Sold by
James Jacqueline
Bought by
Patterson Cheryl An
Purchase Details
Closed on
Apr 14, 1993
Sold by
Roberson Charles F Roberson Hope
Bought by
James Jacqueline
Purchase Details
Closed on
Mar 30, 1993
Sold by
Roberson Charles F
Bought by
James Jacqueline
Purchase Details
Closed on
Aug 3, 1988
Sold by
Estroff William A Estroff Ann-Toni D E
Bought by
Roberson Charles G Roberson Hope
Purchase Details
Closed on
Aug 1, 1988
Sold by
Estroff William A
Bought by
Roberson Charles G
Purchase Details
Closed on
Dec 1, 1986
Sold by
Smith Hugh G
Bought by
Estroff William A
Create a Home Valuation Report for This Property
The Home Valuation Report is an in-depth analysis detailing your home's value as well as a comparison with similar homes in the area
Home Values in the Area
Average Home Value in this Area
Purchase History
| Date | Buyer | Sale Price | Title Company |
|---|---|---|---|
| Patterson Cheryl Ann | -- | -- | |
| Patterson Cheryl An | $52,900 | -- | |
| James Jacqueline | -- | -- | |
| James Jacqueline | $56,700 | -- | |
| Roberson Charles G Roberson Hope | $54,500 | -- | |
| Roberson Charles G | $54,500 | -- | |
| Estroff William A | $47,000 | -- |
Source: Public Records
Tax History Compared to Growth
Tax History
| Year | Tax Paid | Tax Assessment Tax Assessment Total Assessment is a certain percentage of the fair market value that is determined by local assessors to be the total taxable value of land and additions on the property. | Land | Improvement |
|---|---|---|---|---|
| 2025 | $1,807 | $54,756 | $6,400 | $48,356 |
| 2024 | $1,807 | $58,012 | $6,400 | $51,612 |
| 2023 | $853 | $40,792 | $6,400 | $34,392 |
| 2022 | $1,313 | $37,745 | $6,400 | $31,345 |
| 2021 | $1,045 | $26,140 | $6,400 | $19,740 |
| 2020 | $1,033 | $26,140 | $6,400 | $19,740 |
| 2019 | $1,080 | $26,140 | $6,400 | $19,740 |
| 2018 | $1,085 | $26,140 | $6,400 | $19,740 |
| 2017 | $1,026 | $26,140 | $6,400 | $19,740 |
| 2016 | $1,027 | $26,140 | $6,400 | $19,740 |
| 2015 | $1,033 | $26,140 | $6,400 | $19,740 |
| 2014 | $1,034 | $26,140 | $6,400 | $19,740 |
Source: Public Records
Map
Nearby Homes
- 2402 Crystal Ct
- 2204 Glynn Arven Ct
- 3640 Elliott Blvd
- 2165 Rosier Rd
- 2152 Rosier Rd
- 2303 Buckingham Ct
- 2442 Winston Way
- 2380 Winston Way
- 2308 Silverdale Rd
- 3611 Kentwood Dr Unit 1
- 2215 Archer Ln
- 2238 Archer Ln
- 2217 Archer Ln
- 2242 Archer Ln
- 2219 Archer Ln
- 2259 Archer Ln
- 2240 Archer Ln
- 2234 Silverdale Rd
- 2333 Rutherford Ave
- 2331 Rutherford Ave
- 3609 Concord Ct
- 3616 Elliott Blvd
- 3614 Elliott Blvd
- 3618 Elliott Blvd
- 3607 Concord Ct
- 3612 Elliott Blvd
- 3616 Concord Ct
- 2202 Baxter Ct
- 3614 Concord Ct
- 3612 Concord Ct
- 2201 Baxter Ct
- 3620 Elliott Blvd
- 3610 Elliott Blvd
- 3605 Concord Ct
- 3610 Concord Ct
- 3622 Elliott Blvd
- 3608 Elliott Blvd
- 3603 Concord Ct
- 2204 Baxter Ct
- 3608 Concord Ct