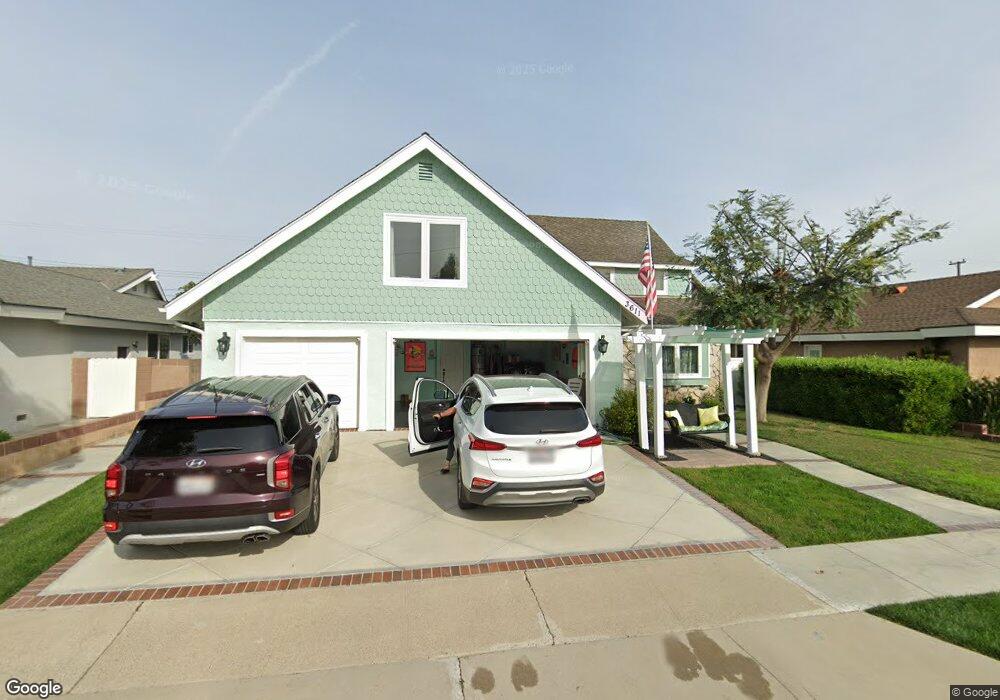
3611 La Colmena Way Los Alamitos, CA 90720
Estimated Value: $1,744,000 - $1,896,000
5
Beds
3
Baths
3,054
Sq Ft
$587/Sq Ft
Est. Value
About This Home
This home is located at 3611 La Colmena Way, Los Alamitos, CA 90720 and is currently estimated at $1,791,862, approximately $586 per square foot. 3611 La Colmena Way is a home located in Orange County with nearby schools including Rossmoor Elementary School, Jack L. Weaver Elementary School, and Oak Middle School.
Ownership History
Date
Name
Owned For
Owner Type
Purchase Details
Closed on
Mar 3, 2008
Sold by
Harpt Nathan S and Harpt Joyce A
Bought by
Kartinen Harry M and Kartinen Cynthia S
Current Estimated Value
Home Financials for this Owner
Home Financials are based on the most recent Mortgage that was taken out on this home.
Original Mortgage
$400,000
Outstanding Balance
$247,988
Interest Rate
5.65%
Mortgage Type
Purchase Money Mortgage
Estimated Equity
$1,543,874
Purchase Details
Closed on
Mar 12, 2004
Sold by
Harpt Nathan S and Harpt Joyce A
Bought by
Harpt Nathan S and Harpt Joyce A
Purchase Details
Closed on
Apr 23, 2003
Sold by
Hughes James A and Hughes Judy L
Bought by
Harpt Nathan S and Harpt Joyce A
Home Financials for this Owner
Home Financials are based on the most recent Mortgage that was taken out on this home.
Original Mortgage
$481,000
Interest Rate
5.61%
Mortgage Type
Purchase Money Mortgage
Create a Home Valuation Report for This Property
The Home Valuation Report is an in-depth analysis detailing your home's value as well as a comparison with similar homes in the area
Home Values in the Area
Average Home Value in this Area
Purchase History
| Date | Buyer | Sale Price | Title Company |
|---|---|---|---|
| Kartinen Harry M | $800,000 | Civic Center Title Services | |
| Harpt Nathan S | -- | -- | |
| Harpt Nathan S | $637,000 | North American Title Co |
Source: Public Records
Mortgage History
| Date | Status | Borrower | Loan Amount |
|---|---|---|---|
| Open | Kartinen Harry M | $400,000 | |
| Previous Owner | Harpt Nathan S | $481,000 |
Source: Public Records
Tax History Compared to Growth
Tax History
| Year | Tax Paid | Tax Assessment Tax Assessment Total Assessment is a certain percentage of the fair market value that is determined by local assessors to be the total taxable value of land and additions on the property. | Land | Improvement |
|---|---|---|---|---|
| 2025 | $11,886 | $1,050,808 | $830,038 | $220,770 |
| 2024 | $11,886 | $1,030,204 | $813,762 | $216,442 |
| 2023 | $11,617 | $1,010,004 | $797,805 | $212,199 |
| 2022 | $11,578 | $990,200 | $782,161 | $208,039 |
| 2021 | $11,327 | $970,785 | $766,825 | $203,960 |
| 2020 | $11,370 | $960,831 | $758,962 | $201,869 |
| 2019 | $10,952 | $941,992 | $744,081 | $197,911 |
| 2018 | $10,460 | $923,522 | $729,491 | $194,031 |
| 2017 | $10,239 | $905,414 | $715,187 | $190,227 |
| 2016 | $10,043 | $887,661 | $701,163 | $186,498 |
| 2015 | $9,933 | $874,328 | $690,631 | $183,697 |
| 2014 | $9,584 | $857,202 | $677,103 | $180,099 |
Source: Public Records
Map
Nearby Homes
- 3701 La Colmena Way
- 3391 Rossmoor Way
- 3361 Rossmoor Way
- 11862 Paseo Bonita
- 3312 Kenilworth Dr
- 3311 Rossmoor Way
- 3362 Saint Albans Dr
- 3845 Farquhar Ave Unit 110
- 3802 Howard Ave
- 3804 Howard Ave
- 3272 Saint Albans Dr
- 11385 Baskerville Rd
- 12111 Reagan St
- 3342 Bradbury Rd Unit 34
- 12100 Montecito Rd Unit 49
- 12278 Bridgewater Way
- 11291 Wembley Rd
- 10842 Pine St
- 3122 Ruth Elaine Dr
- 12200 Montecito Rd Unit K201
- 3631 La Colmena Way
- 3601 La Colmena Way
- 3641 La Colmena Way
- 3591 La Colmena Way
- 11602 Pine St
- 3632 La Colmena Way
- 3651 La Colmena Way
- 11612 Pine St
- 11611 Reagan St
- 11632 Pine St
- 11631 Reagan St
- 3662 La Colmena Way
- 3681 La Colmena Way
- 11642 Pine St
- 11631 Pine St
- 11641 Reagan St
- 3672 La Colmena Way
- 3691 La Colmena Way
- 11632 Reagan St
- 11641 Pine St