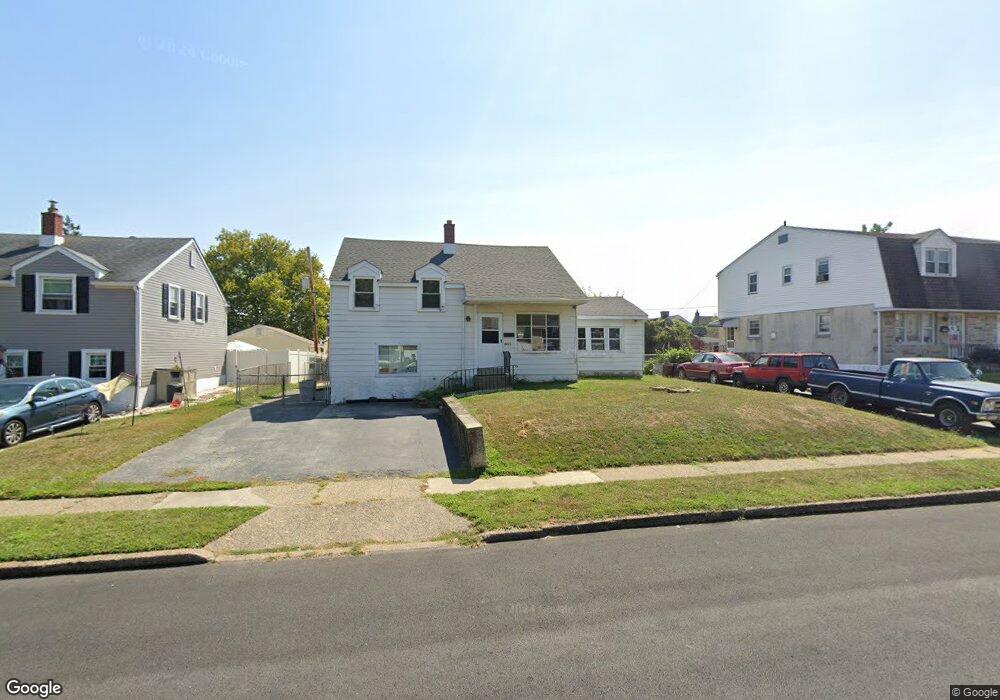
3611 W 13th St Marcus Hook, PA 19061
Estimated Value: $235,000 - $286,000
3
Beds
2
Baths
1,457
Sq Ft
$177/Sq Ft
Est. Value
About This Home
This home is located at 3611 W 13th St, Marcus Hook, PA 19061 and is currently estimated at $258,294, approximately $177 per square foot. 3611 W 13th St is a home located in Delaware County with nearby schools including Chichester Senior High School, Chester Charter School for the Arts, and Frederick Douglass Christian School.
Ownership History
Date
Name
Owned For
Owner Type
Purchase Details
Closed on
Nov 9, 2012
Sold by
Apollo Teri and Apollo James T
Bought by
Apollo Teri
Current Estimated Value
Purchase Details
Closed on
Jun 25, 2007
Sold by
Norbeck Esther M
Bought by
Apollo Teri and Apollo James T
Home Financials for this Owner
Home Financials are based on the most recent Mortgage that was taken out on this home.
Original Mortgage
$145,649
Outstanding Balance
$89,363
Interest Rate
6.24%
Mortgage Type
FHA
Estimated Equity
$168,931
Create a Home Valuation Report for This Property
The Home Valuation Report is an in-depth analysis detailing your home's value as well as a comparison with similar homes in the area
Home Values in the Area
Average Home Value in this Area
Purchase History
| Date | Buyer | Sale Price | Title Company |
|---|---|---|---|
| Apollo Teri | -- | None Available | |
| Apollo Teri | $146,800 | Commonwealth Land Title Insu |
Source: Public Records
Mortgage History
| Date | Status | Borrower | Loan Amount |
|---|---|---|---|
| Open | Apollo Teri | $145,649 |
Source: Public Records
Tax History Compared to Growth
Tax History
| Year | Tax Paid | Tax Assessment Tax Assessment Total Assessment is a certain percentage of the fair market value that is determined by local assessors to be the total taxable value of land and additions on the property. | Land | Improvement |
|---|---|---|---|---|
| 2025 | $4,952 | $125,870 | $34,210 | $91,660 |
| 2024 | $4,952 | $125,870 | $34,210 | $91,660 |
| 2023 | $4,818 | $125,870 | $34,210 | $91,660 |
| 2022 | $4,719 | $125,870 | $34,210 | $91,660 |
| 2021 | $6,659 | $125,870 | $34,210 | $91,660 |
| 2020 | $5,064 | $84,310 | $28,410 | $55,900 |
| 2019 | $5,064 | $84,310 | $28,410 | $55,900 |
| 2018 | $5,076 | $84,310 | $0 | $0 |
| 2017 | $5,043 | $84,310 | $0 | $0 |
| 2016 | $472 | $84,310 | $0 | $0 |
| 2015 | $472 | $84,310 | $0 | $0 |
| 2014 | $463 | $84,310 | $0 | $0 |
Source: Public Records
Map
Nearby Homes
- 1344 Sunset St
- 1004 Sunset St
- 1001 Sunset St
- 1355 Forrest St
- 1150 Pine Ln
- 924 Chestnut St
- 1233 Clover Ln
- 1134 Highland Ave
- 4216 W 7th St
- 3004 W 6th St
- 3000 W 6th St
- 2615 Swarts St
- 2610 Price St
- 2710 Lehman St
- 2708 Lehman St
- 2706 Lehman St
- 1511 Honan St
- 3427 W 3rd St
- 426 Highland Ave
- 424 Highland Ave