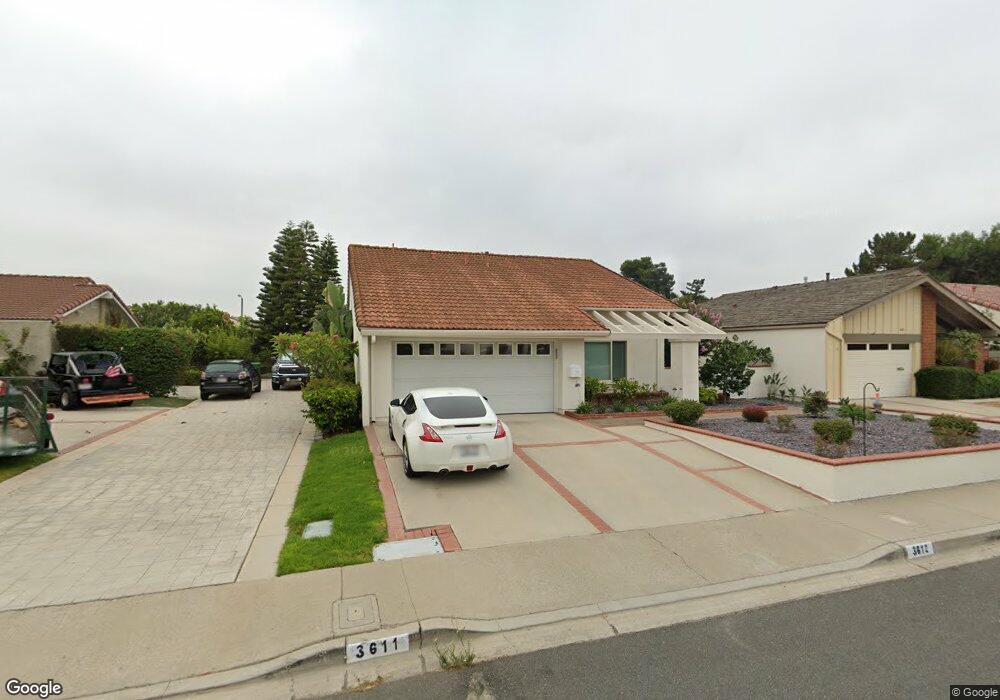
3612 Marin Dr Irvine, CA 92606
Walnut NeighborhoodEstimated Value: $1,349,097 - $1,581,000
3
Beds
2
Baths
1,367
Sq Ft
$1,093/Sq Ft
Est. Value
About This Home
This home is located at 3612 Marin Dr, Irvine, CA 92606 and is currently estimated at $1,494,774, approximately $1,093 per square foot. 3612 Marin Dr is a home located in Orange County with nearby schools including College Park Elementary School, Venado Middle School, and Irvine High School.
Ownership History
Date
Name
Owned For
Owner Type
Purchase Details
Closed on
Nov 18, 2010
Sold by
Eissing Erwin J and Eissing Eleanor A
Bought by
Eissing Erwin J and Eissing Eleanor A
Current Estimated Value
Purchase Details
Closed on
Oct 10, 2007
Sold by
Eissing Mark E and Eissing Kimberly A
Bought by
Eissing Erwin J and Eissing Eleanor A
Purchase Details
Closed on
May 28, 2003
Sold by
Eissing Kimberly A and Bowman Kimberly
Bought by
Eissing Mark E and Eissing Kimberly A
Home Financials for this Owner
Home Financials are based on the most recent Mortgage that was taken out on this home.
Original Mortgage
$318,000
Interest Rate
5.71%
Mortgage Type
Purchase Money Mortgage
Purchase Details
Closed on
Oct 15, 2001
Sold by
Ground James H and Ground Irene
Bought by
Bowman Kimberly
Home Financials for this Owner
Home Financials are based on the most recent Mortgage that was taken out on this home.
Original Mortgage
$321,750
Interest Rate
6.87%
Create a Home Valuation Report for This Property
The Home Valuation Report is an in-depth analysis detailing your home's value as well as a comparison with similar homes in the area
Home Values in the Area
Average Home Value in this Area
Purchase History
| Date | Buyer | Sale Price | Title Company |
|---|---|---|---|
| Eissing Erwin J | -- | None Available | |
| Eissing Erwin J | -- | None Available | |
| Eissing Mark E | -- | Equity Title Company | |
| Bowman Kimberly | $339,000 | First American Title Co |
Source: Public Records
Mortgage History
| Date | Status | Borrower | Loan Amount |
|---|---|---|---|
| Previous Owner | Eissing Mark E | $318,000 | |
| Previous Owner | Bowman Kimberly | $321,750 |
Source: Public Records
Tax History Compared to Growth
Tax History
| Year | Tax Paid | Tax Assessment Tax Assessment Total Assessment is a certain percentage of the fair market value that is determined by local assessors to be the total taxable value of land and additions on the property. | Land | Improvement |
|---|---|---|---|---|
| 2025 | $5,225 | $500,348 | $389,164 | $111,184 |
| 2024 | $5,225 | $490,538 | $381,534 | $109,004 |
| 2023 | $5,089 | $480,920 | $374,053 | $106,867 |
| 2022 | $4,988 | $471,491 | $366,719 | $104,772 |
| 2021 | $4,871 | $462,247 | $359,529 | $102,718 |
| 2020 | $4,843 | $457,508 | $355,843 | $101,665 |
| 2019 | $4,735 | $448,538 | $348,866 | $99,672 |
| 2018 | $4,649 | $439,744 | $342,026 | $97,718 |
| 2017 | $4,552 | $431,122 | $335,320 | $95,802 |
| 2016 | $4,351 | $422,669 | $328,745 | $93,924 |
| 2015 | $4,232 | $416,321 | $323,807 | $92,514 |
| 2014 | $4,149 | $408,166 | $317,464 | $90,702 |
Source: Public Records
Map
Nearby Homes
- 14561 Linden Ave
- 14375 Majorca Ave
- 3852 Uris Ct
- 20 Nevada
- 16 Arizona
- 14112 Picasso Ct
- 46 Nebraska
- 14172 Moore Ct
- 3621 Myrtle St
- 3871 Banyan St
- 4071 Loma St
- 3852 Blackthorn St
- 43 Riverstone
- 54 Night Bloom
- 424 Deerfield Ave Unit 172
- 264 Blue Sky Dr Unit 264
- 311 Nimbus Dr
- 369 Deerfield Ave Unit 35
- 410 Hudson Dr
- 32 Goldenbush
- 3606 Marin Dr
- 3611 Marin Dr
- 3601 Marin Dr
- 3602 Marin Dr
- 3591 Marin Dr
- 3596 Marin Dr
- 3642 Provincetown Ave
- 3592 Marin Dr
- 3612 Carmel Ave
- 3602 Carmel Ave
- 3582 Carmel Ave
- 3572 Carmel Ave
- 3581 Marin Dr
- 3571 Marin Dr
- 3641 Provincetown Ave
- 3582 Marin Dr
- 3592 Carmel Ave
- 3562 Carmel Ave
- 3652 Provincetown Ave
- 3655 Provincetown Ave