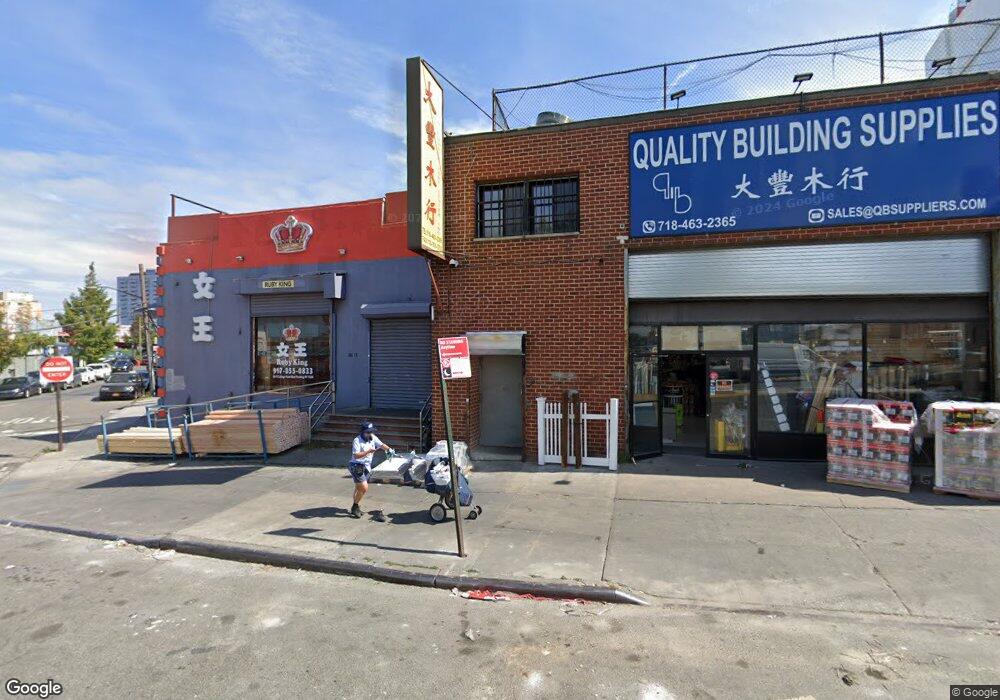
3613 College Point Blvd Flushing, NY 11354
Flushing NeighborhoodEstimated Value: $2,321,664
--
Bed
--
Bath
3,950
Sq Ft
$588/Sq Ft
Est. Value
About This Home
This home is located at 3613 College Point Blvd, Flushing, NY 11354 and is currently estimated at $2,321,664, approximately $587 per square foot. 3613 College Point Blvd is a home located in Queens County with nearby schools including P.S. 20 John Bowne Elementary, J.H.S. 189Q Daniel Carter Beard, and Flushing High School.
Ownership History
Date
Name
Owned For
Owner Type
Purchase Details
Closed on
Oct 22, 2020
Sold by
Still Around Llc
Bought by
Still Around Llc
Current Estimated Value
Home Financials for this Owner
Home Financials are based on the most recent Mortgage that was taken out on this home.
Original Mortgage
$1,839,381
Outstanding Balance
$1,636,031
Interest Rate
2.9%
Mortgage Type
Purchase Money Mortgage
Estimated Equity
$685,633
Purchase Details
Closed on
May 9, 2008
Sold by
Lych Enterprises Corp
Bought by
Still Around Llc
Purchase Details
Closed on
Feb 25, 1997
Sold by
Lawrence Ave Realty Corp
Bought by
Lych Enterprises Corp
Home Financials for this Owner
Home Financials are based on the most recent Mortgage that was taken out on this home.
Original Mortgage
$220,000
Interest Rate
7.5%
Mortgage Type
Commercial
Create a Home Valuation Report for This Property
The Home Valuation Report is an in-depth analysis detailing your home's value as well as a comparison with similar homes in the area
Home Values in the Area
Average Home Value in this Area
Purchase History
| Date | Buyer | Sale Price | Title Company |
|---|---|---|---|
| Still Around Llc | -- | -- | |
| Still Around Llc | -- | -- | |
| Still Around Llc | $1,400,000 | -- | |
| Still Around Llc | $1,400,000 | -- | |
| Lych Enterprises Corp | $380,000 | First American Title Ins Co | |
| Lych Enterprises Corp | $380,000 | First American Title Ins Co |
Source: Public Records
Mortgage History
| Date | Status | Borrower | Loan Amount |
|---|---|---|---|
| Open | Still Around Llc | $1,839,381 | |
| Closed | Still Around Llc | $1,839,381 | |
| Previous Owner | Lych Enterprises Corp | $220,000 |
Source: Public Records
Tax History Compared to Growth
Tax History
| Year | Tax Paid | Tax Assessment Tax Assessment Total Assessment is a certain percentage of the fair market value that is determined by local assessors to be the total taxable value of land and additions on the property. | Land | Improvement |
|---|---|---|---|---|
| 2025 | $50,047 | $476,010 | $167,850 | $308,160 |
| 2024 | $50,047 | $472,500 | $167,850 | $304,650 |
| 2023 | $50,572 | $477,450 | $167,850 | $309,600 |
| 2022 | $54,941 | $544,500 | $167,850 | $376,650 |
| 2021 | $42,541 | $397,800 | $167,850 | $229,950 |
| 2020 | $54,074 | $530,100 | $167,850 | $362,250 |
| 2019 | $49,546 | $540,900 | $167,850 | $373,050 |
| 2018 | $44,900 | $427,050 | $167,850 | $259,200 |
| 2017 | $40,254 | $382,860 | $167,850 | $215,010 |
| 2016 | $38,561 | $382,860 | $167,850 | $215,010 |
| 2015 | $10,110 | $307,890 | $153,630 | $154,260 |
| 2014 | $10,110 | $271,530 | $135,720 | $135,810 |
Source: Public Records
Map
Nearby Homes
- 133-25 37th Ave Unit 18-F
- 133-25 37th Ave Unit PHG
- 133-25 37th Ave Unit PHE
- 133-25 37th Ave Unit PHD
- 133-25 37th Ave Unit PHB
- 133-25 37th Ave Unit 17H
- 133-25 37th Ave Unit 16H
- 133-25 37th Ave Unit 18L
- 133-25 37th Ave Unit 6L
- 133-25 37th Ave Unit 18C
- 133-25 37th Ave Unit 17C
- 133-25 37th Ave Unit 16C
- 133-25 37th Ave Unit 15C
- 133-25 37th Ave Unit 18B
- 133-25 37th Ave Unit 17B
- 133-25 37th Ave Unit 16B
- 133-25 37th Ave Unit 15B
- 133-25 37th Ave Unit 6-D
- 133-25 37th Ave Unit 18-D
- 133-25 37th Ave Unit PHJ
- 3613 College Point Blvd
- 3625 College Point Blvd
- 13306 King Rd
- 13306 King Rd
- 13306 King Rd
- 13316 King Rd
- 36-11 College Point Blvd
- 3609 College Point Blvd
- 3607 College Point Blvd
- 3603 College Point Blvd
- 3605 College Point Blvd
- 13326 King Rd
- 3601 College Point Blvd
- 3612 Budd Place
- 13322 King Rd
- 35-50I College Point Blvd
- 133-26 Bud Place
- 3604 Budd Place
- 13324 36th Rd
- 36 College Point Blvd