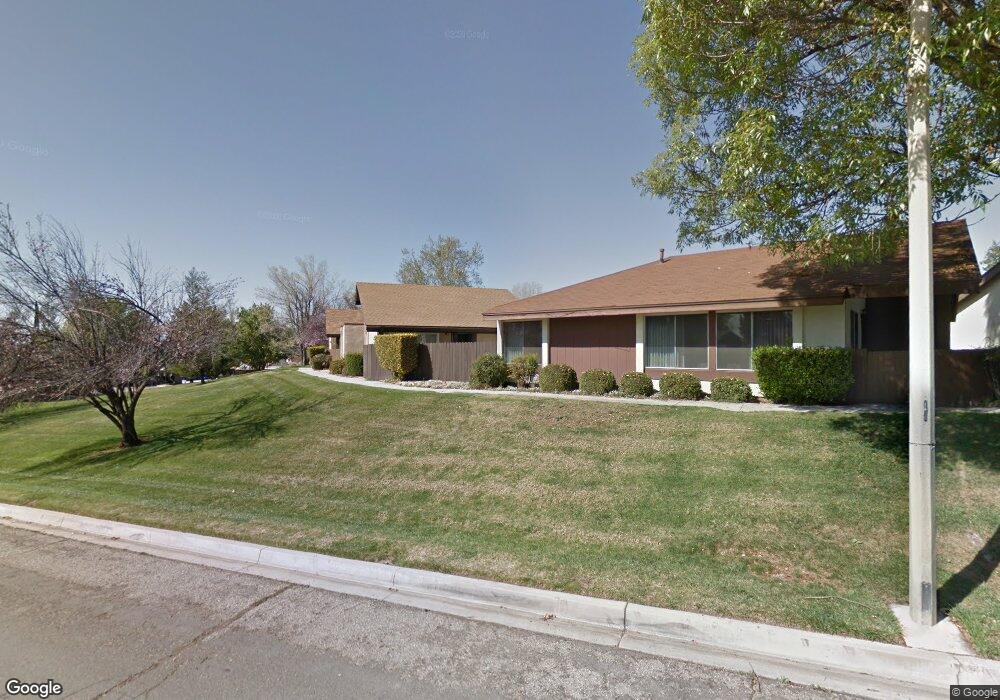
36137 Tamarisk Cir Yucaipa, CA 92399
Estimated Value: $380,795 - $410,000
2
Beds
2
Baths
1,057
Sq Ft
$379/Sq Ft
Est. Value
About This Home
This home is located at 36137 Tamarisk Cir, Yucaipa, CA 92399 and is currently estimated at $400,449, approximately $378 per square foot. 36137 Tamarisk Cir is a home located in San Bernardino County with nearby schools including Wildwood Elementary School, Mesa View Middle School, and Yucaipa High School.
Ownership History
Date
Name
Owned For
Owner Type
Purchase Details
Closed on
Jan 21, 2010
Sold by
Peck James R
Bought by
Rooney George H and Stone Sally D
Current Estimated Value
Purchase Details
Closed on
Nov 17, 2006
Sold by
Peck Connie L
Bought by
Peck James R and Peck Connie L
Purchase Details
Closed on
May 12, 2003
Sold by
Laushine Mildred E
Bought by
Laushine Mildred E and Mildred E Laushine Trust
Purchase Details
Closed on
Apr 21, 2003
Sold by
Laushine Mildred E
Bought by
Laushine Mildred E
Purchase Details
Closed on
Jan 29, 1999
Sold by
Laushine Mildred E
Bought by
Laushine Mildred E and Peck Connie Lee
Purchase Details
Closed on
Oct 9, 1998
Sold by
Liang Phillip W and Liang Joanne K
Bought by
Laushine Mildred E
Home Financials for this Owner
Home Financials are based on the most recent Mortgage that was taken out on this home.
Original Mortgage
$56,800
Interest Rate
6.42%
Create a Home Valuation Report for This Property
The Home Valuation Report is an in-depth analysis detailing your home's value as well as a comparison with similar homes in the area
Home Values in the Area
Average Home Value in this Area
Purchase History
| Date | Buyer | Sale Price | Title Company |
|---|---|---|---|
| Rooney George H | $126,000 | Lawyers Title | |
| Peck James R | -- | None Available | |
| Peck James R | -- | None Available | |
| Peck Consuella Lee | -- | None Available | |
| Laushine Mildred E | -- | -- | |
| Laushine Mildred E | -- | -- | |
| Laushine Mildred E | -- | -- | |
| Laushine Mildred E | $71,000 | First American Title Ins Co |
Source: Public Records
Mortgage History
| Date | Status | Borrower | Loan Amount |
|---|---|---|---|
| Previous Owner | Laushine Mildred E | $56,800 |
Source: Public Records
Tax History Compared to Growth
Tax History
| Year | Tax Paid | Tax Assessment Tax Assessment Total Assessment is a certain percentage of the fair market value that is determined by local assessors to be the total taxable value of land and additions on the property. | Land | Improvement |
|---|---|---|---|---|
| 2025 | $2,270 | $162,648 | $48,795 | $113,853 |
| 2024 | $2,270 | $159,459 | $47,838 | $111,621 |
| 2023 | $2,194 | $156,332 | $46,900 | $109,432 |
| 2022 | $2,149 | $153,266 | $45,980 | $107,286 |
| 2021 | $2,109 | $150,260 | $45,078 | $105,182 |
| 2020 | $2,115 | $148,719 | $44,616 | $104,103 |
| 2019 | $2,038 | $145,803 | $43,741 | $102,062 |
| 2018 | $1,764 | $142,944 | $42,883 | $100,061 |
| 2017 | $1,726 | $140,141 | $42,042 | $98,099 |
| 2016 | $1,703 | $137,393 | $41,218 | $96,175 |
| 2015 | $1,601 | $135,329 | $40,599 | $94,730 |
| 2014 | $1,568 | $132,678 | $39,804 | $92,874 |
Source: Public Records
Map
Nearby Homes
- 13690 Cottonwood Trail
- 13607 Chaparral Trail
- 36029 Leah Ln
- 35994 Leah Ln
- 13622 Canyon Crest Rd
- 477 E County Line Rd
- 35854 Rebecca Rd
- 36472 County Line Rd
- 35824 Rebecca Rd
- 36123 Serape Dr
- 13514 Big Sky Ct
- 13559 Fremont St
- 375 E County Line Rd
- 1023 Fremont St
- 35710 Avenue H
- 35579 Country Creek Dr
- 34529 Wildwood Canyon Rd
- 360 E Avenue L
- 35885 Wildwood Crest Dr
- 35883 Wildwood Crest Dr
- 36135 Tamarisk Cir
- 36139 Tamarisk Cir
- 36131 Tamarisk Cir
- 36143 Tamarisk Cir
- 36148 Tamarisk Cir
- 36146 Tamarisk Cir
- 13670 Dogwood Trail
- 36142 Tamarisk Cir
- 36138 Tamarisk Cir
- 13659 Dogwood Trail
- 36130 Tamarisk Cir
- 13676 Dogwood Trail
- 36106 Alder Cir
- 13662 Dogwood Trail
- 36102 Fair Oak Trail
- 13644 Sumac Loop
- 36105 Alder Cir
- 13661 Dogwood Trail
- 13642 Sumac Loop
- 13699 Dogwood Trail