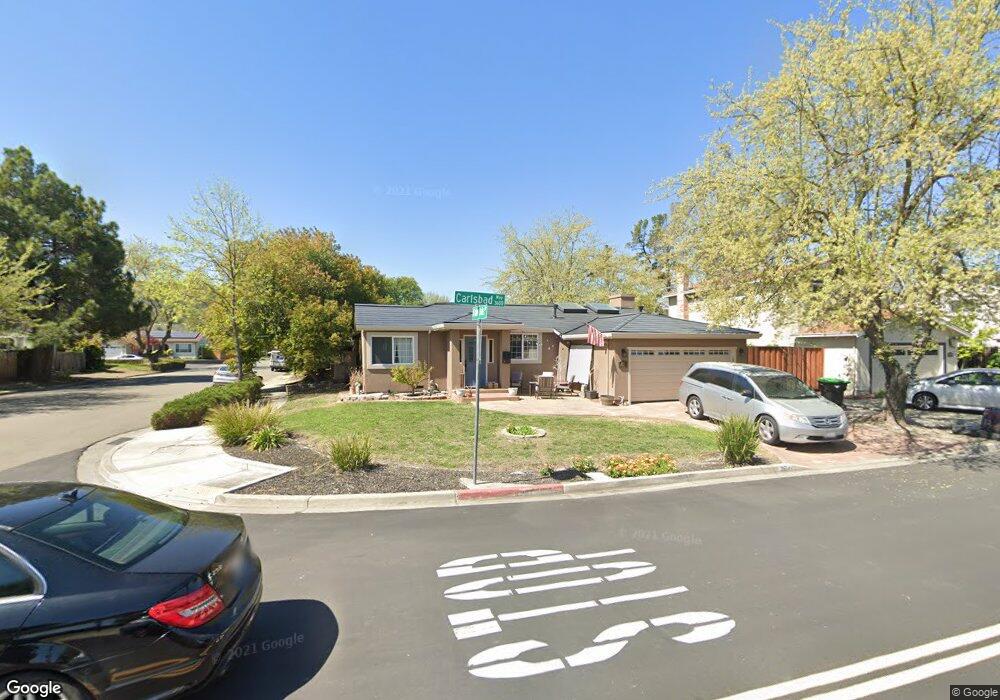
3614 Carlsbad Way Pleasanton, CA 94588
Valley Trails NeighborhoodEstimated Value: $1,401,440 - $1,543,000
3
Beds
2
Baths
1,950
Sq Ft
$740/Sq Ft
Est. Value
About This Home
This home is located at 3614 Carlsbad Way, Pleasanton, CA 94588 and is currently estimated at $1,442,360, approximately $739 per square foot. 3614 Carlsbad Way is a home located in Alameda County with nearby schools including Donlon Elementary School, Thomas S. Hart Middle School, and Foothill High School.
Ownership History
Date
Name
Owned For
Owner Type
Purchase Details
Closed on
Aug 26, 2024
Sold by
Larson Scott M
Bought by
Larson Jo Maripat L
Current Estimated Value
Purchase Details
Closed on
Jan 24, 2023
Sold by
Laccay Janice and Laccay Raymond
Bought by
Laccay Janice and Laccay Raymond
Purchase Details
Closed on
Feb 18, 2011
Sold by
Laccay Raymond and Laccay Josephine
Bought by
Laccay Janice and Laccay Raymond
Home Financials for this Owner
Home Financials are based on the most recent Mortgage that was taken out on this home.
Original Mortgage
$390,000
Interest Rate
4.67%
Mortgage Type
New Conventional
Purchase Details
Closed on
Jul 18, 2008
Sold by
Lee Anthony and Lee Ernestine A
Bought by
Laccay Raymond and Laccay Josephine
Home Financials for this Owner
Home Financials are based on the most recent Mortgage that was taken out on this home.
Original Mortgage
$400,000
Interest Rate
5.25%
Mortgage Type
Purchase Money Mortgage
Create a Home Valuation Report for This Property
The Home Valuation Report is an in-depth analysis detailing your home's value as well as a comparison with similar homes in the area
Home Values in the Area
Average Home Value in this Area
Purchase History
| Date | Buyer | Sale Price | Title Company |
|---|---|---|---|
| Larson Jo Maripat L | -- | None Listed On Document | |
| Larson Jo Maripat L | -- | None Listed On Document | |
| Laccay Janice | -- | -- | |
| Laccay Janice | -- | Old Republic Title Company | |
| Laccay Raymond | $500,000 | First American Title Company |
Source: Public Records
Mortgage History
| Date | Status | Borrower | Loan Amount |
|---|---|---|---|
| Previous Owner | Laccay Janice | $390,000 | |
| Previous Owner | Laccay Raymond | $400,000 |
Source: Public Records
Tax History Compared to Growth
Tax History
| Year | Tax Paid | Tax Assessment Tax Assessment Total Assessment is a certain percentage of the fair market value that is determined by local assessors to be the total taxable value of land and additions on the property. | Land | Improvement |
|---|---|---|---|---|
| 2025 | $10,009 | $864,884 | $259,465 | $605,419 |
| 2024 | $10,009 | $847,928 | $254,378 | $593,550 |
| 2023 | $7,307 | $618,838 | $185,651 | $433,187 |
| 2022 | $6,922 | $599,708 | $182,012 | $424,696 |
| 2021 | $6,744 | $587,814 | $178,444 | $416,370 |
| 2020 | $6,657 | $588,718 | $176,615 | $412,103 |
| 2019 | $6,736 | $577,178 | $173,153 | $404,025 |
| 2018 | $6,599 | $565,864 | $169,759 | $396,105 |
| 2017 | $6,430 | $554,768 | $166,430 | $388,338 |
| 2016 | $5,933 | $543,894 | $163,168 | $380,726 |
| 2015 | $5,822 | $535,728 | $160,718 | $375,010 |
| 2014 | $5,924 | $525,238 | $157,571 | $367,667 |
Source: Public Records
Map
Nearby Homes
- 3530 Carlsbad Ct
- 5988 Corte Cerritos
- 6355 Singletree Way
- 3636 Shenandoah Ct
- 6056 Corte Encinas
- 3162 Paseo Robles
- 6083 Corte Montanas
- 6244 Robin Ct
- 4205 Dorman Rd
- 6781 Menlo Ct
- 5995 Via Del Cielo
- 4410 Clovewood Ln
- 4336 Muirwood Dr
- 4421 Muirwood Dr
- 4504 Muirwood Dr
- 6686 Via San Blas
- 7606 Desertwood Ln
- 7758 Forsythia Ct
- 4645 Helpert Ct
- 2531 Willowren Way
- 3628 Carlsbad Way
- 3605 Glacier Ct N
- 3619 Glacier Ct N
- 3642 Carlsbad Way
- 3596 Carlsbad Ct
- 6188 Crater Lake Ct
- 3587 Glacier Ct S
- 3633 Glacier Ct N
- 3574 Carlsbad Ct
- 3656 Carlsbad Way
- 3599 Carlsbad Ct
- 6174 Crater Lake Ct
- 6185 Crater Lake Ct
- 3573 Glacier Ct S
- 3647 Glacier Ct N
- 3577 Carlsbad Ct
- 3602 Glacier Ct N
- 3552 Carlsbad Ct
- 3670 Carlsbad Way
- 6160 Crater Lake Ct