
Seller's Agent in 2020
Bonnie Overbeck
3 B Realty Group LLC
(513) 278-7089
4 in this area
89 Total Sales
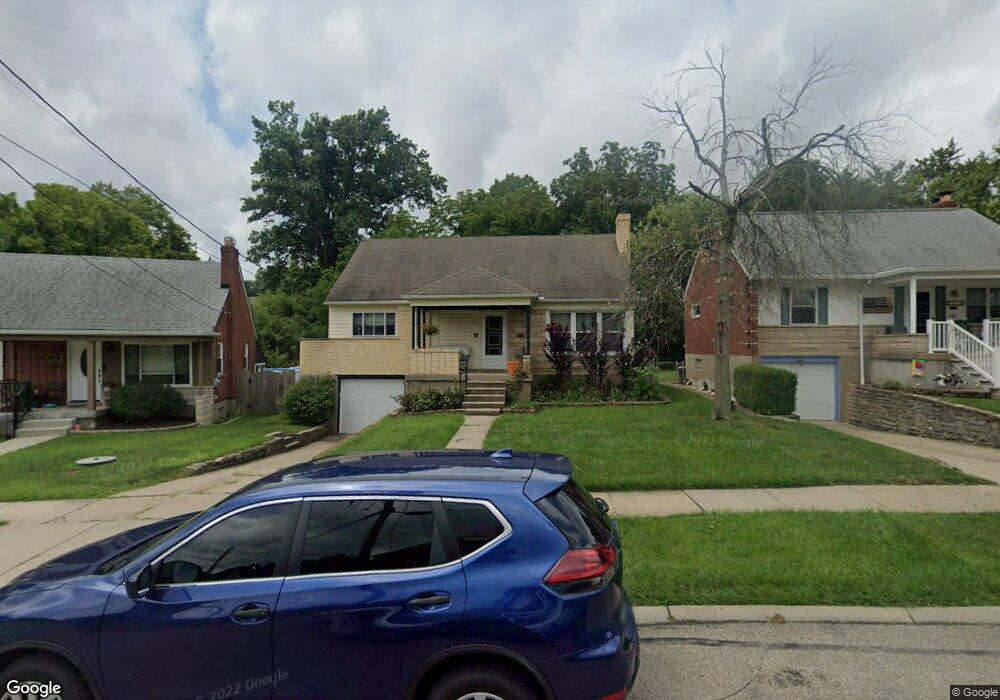
Estimated Value: $205,000 - $255,000
Wonderful family home on a cul de sac with nice porch to enjoy the outdoors. Loads of updates and completely renovated bath. Built in dressers upstairs, fenced yard backs up to a creek & woods w/large fire pit. $20 apllication fee per adult.
| Date | Buyer | Sale Price | Title Company |
|---|---|---|---|
| Cowan Kelly W | $136,000 | None Available | |
| Riley Jarrod W | $81,000 | Ltoc | |
| Stevens Donald E | -- | -- |
| Date | Status | Borrower | Loan Amount |
|---|---|---|---|
| Open | Cowan Kelly W | $115,600 | |
| Previous Owner | Riley Jarrod W | $74,850 |
| Date | Event | Price | List to Sale | Price per Sq Ft | Prior Sale |
|---|---|---|---|---|---|
| 05/18/2020 05/18/20 | Off Market | $1,395 | -- | -- | |
| 03/26/2020 03/26/20 | Off Market | $136,000 | -- | -- | |
| 02/15/2020 02/15/20 | Rented | $1,395 | 0.0% | -- | |
| 02/05/2020 02/05/20 | Under Contract | -- | -- | -- | |
| 01/20/2020 01/20/20 | For Rent | $1,395 | 0.0% | -- | |
| 12/27/2019 12/27/19 | Sold | $136,000 | -2.9% | $98 / Sq Ft | View Prior Sale |
| 11/20/2019 11/20/19 | Pending | -- | -- | -- | |
| 11/12/2019 11/12/19 | For Sale | $140,000 | +72.8% | $101 / Sq Ft | |
| 09/11/2014 09/11/14 | Off Market | $81,000 | -- | -- | |
| 06/13/2014 06/13/14 | Sold | $81,000 | -4.6% | $58 / Sq Ft | View Prior Sale |
| 05/17/2014 05/17/14 | Pending | -- | -- | -- | |
| 05/13/2014 05/13/14 | For Sale | $84,900 | -- | $61 / Sq Ft |
| Year | Tax Paid | Tax Assessment Tax Assessment Total Assessment is a certain percentage of the fair market value that is determined by local assessors to be the total taxable value of land and additions on the property. | Land | Improvement |
|---|---|---|---|---|
| 2024 | $3,033 | $56,564 | $11,750 | $44,814 |
| 2023 | $2,981 | $56,564 | $11,750 | $44,814 |
| 2022 | $2,949 | $47,601 | $10,490 | $37,111 |
| 2021 | $2,710 | $47,601 | $10,490 | $37,111 |
| 2020 | $2,602 | $47,601 | $10,490 | $37,111 |
| 2019 | $2,067 | $34,437 | $9,366 | $25,071 |
| 2018 | $2,070 | $34,437 | $9,366 | $25,071 |
| 2017 | $1,952 | $34,437 | $9,366 | $25,071 |
| 2016 | $1,612 | $28,351 | $9,622 | $18,729 |
| 2015 | $1,626 | $28,351 | $9,622 | $18,729 |
| 2014 | $1,122 | $28,351 | $9,622 | $18,729 |
| 2013 | $1,644 | $39,568 | $9,720 | $29,848 |
Seller's Agent in 2020
Bonnie Overbeck
3 B Realty Group LLC
(513) 278-7089
4 in this area
89 Total Sales
Buyer's Agent in 2020
Coleen Garrett
3 B Realty Group LLC
(937) 654-7233
8 in this area
66 Total Sales
Seller's Agent in 2019
Carol Buckley
Comey & Shepherd
(513) 477-5360
25 Total Sales
D
Buyer's Agent in 2019
Dori Menninger
3 B Realty Group LLC
P
Seller's Agent in 2014
Peggie Frey
Sibcy Cline
Buyer's Agent in 2014
Bob Jansen
RE/MAX
(513) 598-9565
3 in this area
54 Total Sales