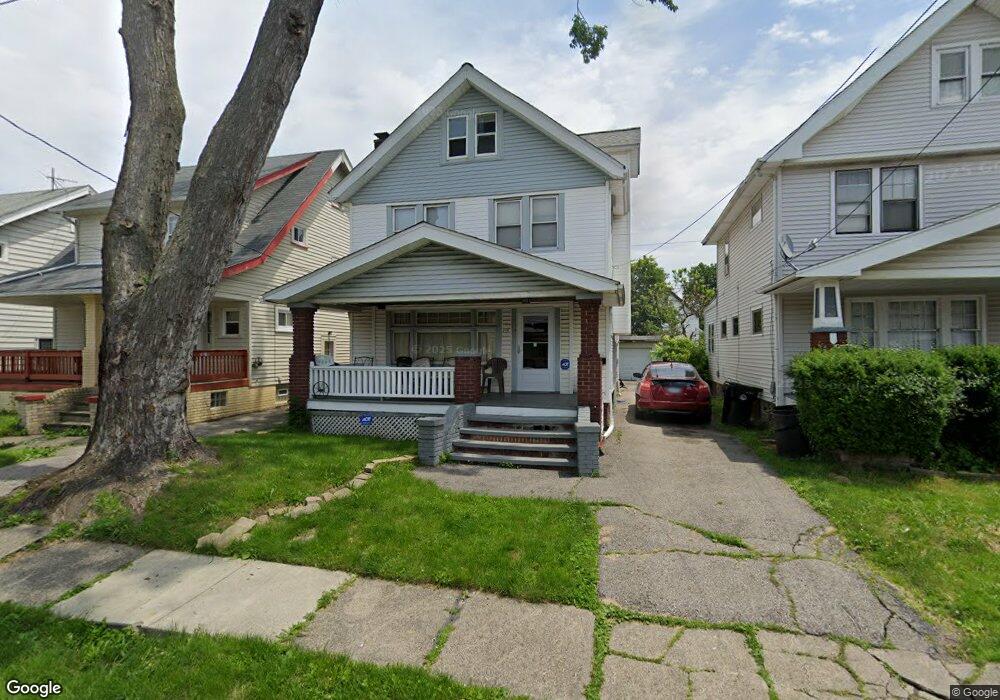
3615 W 103rd St Cleveland, OH 44111
West Boulevard NeighborhoodEstimated Value: $130,000 - $197,000
4
Beds
1
Bath
1,337
Sq Ft
$112/Sq Ft
Est. Value
About This Home
This home is located at 3615 W 103rd St, Cleveland, OH 44111 and is currently estimated at $149,185, approximately $111 per square foot. 3615 W 103rd St is a home located in Cuyahoga County with nearby schools including Almira Academy, Artemus Ward School, and Benjamin Franklin.
Ownership History
Date
Name
Owned For
Owner Type
Purchase Details
Closed on
Nov 27, 2017
Sold by
Np
Bought by
Carter Antoinette
Current Estimated Value
Purchase Details
Closed on
Jun 27, 2001
Sold by
Horsman Thomas P
Bought by
Danly Investments Inc
Home Financials for this Owner
Home Financials are based on the most recent Mortgage that was taken out on this home.
Original Mortgage
$250,000
Interest Rate
7.18%
Purchase Details
Closed on
May 17, 2001
Sold by
Horsman Thomas P
Bought by
Horsman Thomas P
Home Financials for this Owner
Home Financials are based on the most recent Mortgage that was taken out on this home.
Original Mortgage
$250,000
Interest Rate
7.18%
Purchase Details
Closed on
Oct 15, 1990
Sold by
Gurgol Paul Frederick
Bought by
Horsman Thomas P
Purchase Details
Closed on
Jul 14, 1988
Sold by
Stearns Marshall J
Bought by
Gurgol Paul Frederick
Purchase Details
Closed on
Sep 5, 1985
Sold by
Gary A Smith
Bought by
Stearns Marshall J
Purchase Details
Closed on
Jan 19, 1979
Sold by
Smith Gary A
Bought by
Gary A Smith
Purchase Details
Closed on
Jan 1, 1975
Bought by
Hollis Frank J
Create a Home Valuation Report for This Property
The Home Valuation Report is an in-depth analysis detailing your home's value as well as a comparison with similar homes in the area
Home Values in the Area
Average Home Value in this Area
Purchase History
| Date | Buyer | Sale Price | Title Company |
|---|---|---|---|
| Carter Antoinette | -- | None Available | |
| Danly Investments Inc | $47,500 | -- | |
| Horsman Thomas P | -- | -- | |
| Horsman Thomas P | $49,500 | -- | |
| Gurgol Paul Frederick | $40,000 | -- | |
| Stearns Marshall J | $37,500 | -- | |
| Gary A Smith | -- | -- | |
| Smith Gary A | $34,500 | -- | |
| Hollis Frank J | -- | -- |
Source: Public Records
Mortgage History
| Date | Status | Borrower | Loan Amount |
|---|---|---|---|
| Previous Owner | Danly Investments Inc | $250,000 |
Source: Public Records
Tax History Compared to Growth
Tax History
| Year | Tax Paid | Tax Assessment Tax Assessment Total Assessment is a certain percentage of the fair market value that is determined by local assessors to be the total taxable value of land and additions on the property. | Land | Improvement |
|---|---|---|---|---|
| 2024 | $2,354 | $35,910 | $6,650 | $29,260 |
| 2023 | $1,808 | $23,840 | $3,640 | $20,200 |
| 2022 | $1,798 | $23,835 | $3,640 | $20,195 |
| 2021 | $1,780 | $23,840 | $3,640 | $20,200 |
| 2020 | $1,620 | $18,340 | $2,800 | $15,540 |
| 2019 | $1,500 | $52,400 | $8,000 | $44,400 |
| 2018 | $2,122 | $18,340 | $2,800 | $15,540 |
| 2017 | $1,863 | $22,120 | $3,080 | $19,040 |
| 2016 | $1,856 | $22,120 | $3,080 | $19,040 |
| 2015 | $43,837 | $22,120 | $3,080 | $19,040 |
| 2014 | $43,837 | $24,050 | $3,360 | $20,690 |
Source: Public Records
Map
Nearby Homes
- 3598 W 103rd St
- 10326 Thrush Ave
- 10411 Jasper Rd
- 10612 Linnet Ave
- 10917 Linnet Ave
- 3515 W 100th St
- 10909 Fortune Ave
- 11101 Fortune Ave
- 10310 Adelaide Ave
- 3512 W 98th St
- 10904 Dixon Rd
- 3515 W 98th St
- 10216 Champion Ave
- 3628 W 114th St
- 3451 W 98th St
- 3497 W 97th St
- 11420 Thrush Ave
- 3500 W 95th St
- 3393 W 99th St
- 11002 Parkhurst Dr
- 3611 W 103rd St
- 3619 W 103rd St
- 3607 W 103rd St
- 3623 W 103rd St
- 3603 W 103rd St
- 3627 W 103rd St
- 3610 W 102nd St
- 3614 W 102nd St
- 3606 W 102nd St
- 3599 W 103rd St
- 3631 W 103rd St
- 3618 W 102nd St
- 3614 W 103rd St
- 3610 W 103rd St
- 3618 W 103rd St
- 3602 W 102nd St
- 3606 W 103rd St
- 3622 W 103rd St
- 3622 W 102nd St
- 3595 W 103rd St