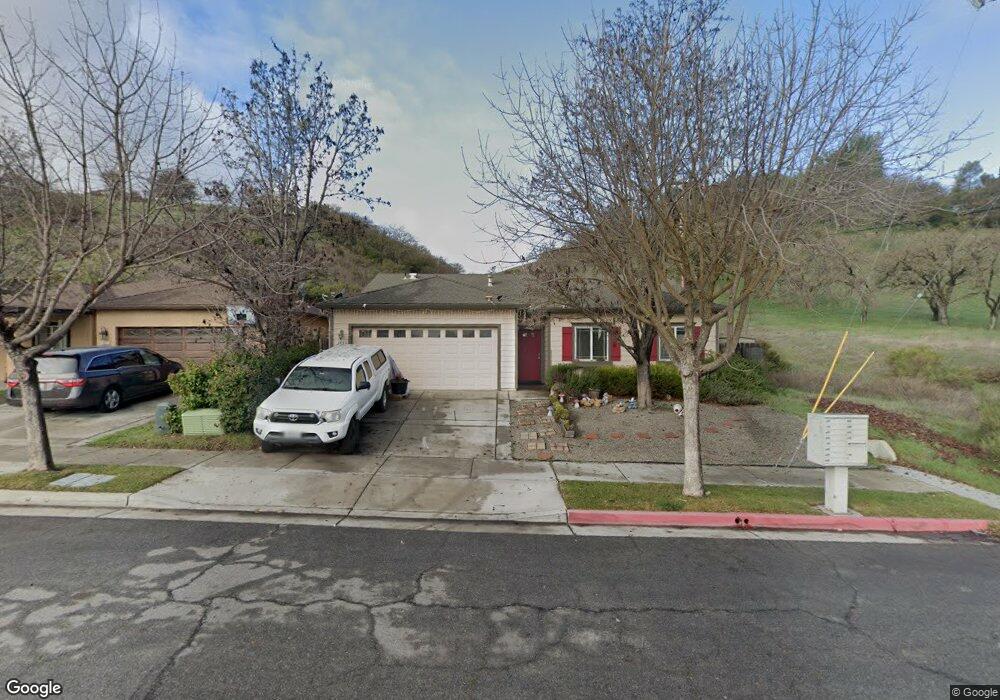
3619 Vine St Unit 12 Paso Robles, CA 93446
Estimated Value: $608,000 - $726,000
4
Beds
2
Baths
1,240
Sq Ft
$540/Sq Ft
Est. Value
About This Home
This home is located at 3619 Vine St Unit 12, Paso Robles, CA 93446 and is currently estimated at $670,035, approximately $540 per square foot. 3619 Vine St Unit 12 is a home located in San Luis Obispo County with nearby schools including Georgia Brown Dual Immersion Magnet Elementary School, George H. Flamson Middle School, and Paso Robles High School.
Ownership History
Date
Name
Owned For
Owner Type
Purchase Details
Closed on
May 5, 2017
Sold by
Zaiser Michael J and Zaiser Libby S
Bought by
Park Andrew Hyeon
Current Estimated Value
Home Financials for this Owner
Home Financials are based on the most recent Mortgage that was taken out on this home.
Original Mortgage
$399,000
Outstanding Balance
$331,636
Interest Rate
4.08%
Mortgage Type
VA
Estimated Equity
$338,399
Purchase Details
Closed on
Mar 4, 2005
Sold by
North Ridge Homes Llc
Bought by
Zaiser Michael J and Zaiser Libby S
Home Financials for this Owner
Home Financials are based on the most recent Mortgage that was taken out on this home.
Original Mortgage
$268,100
Interest Rate
1.37%
Mortgage Type
New Conventional
Create a Home Valuation Report for This Property
The Home Valuation Report is an in-depth analysis detailing your home's value as well as a comparison with similar homes in the area
Home Values in the Area
Average Home Value in this Area
Purchase History
| Date | Buyer | Sale Price | Title Company |
|---|---|---|---|
| Park Andrew Hyeon | $399,000 | First American Title Company | |
| Zaiser Michael J | $383,500 | Chicago Title Company |
Source: Public Records
Mortgage History
| Date | Status | Borrower | Loan Amount |
|---|---|---|---|
| Open | Park Andrew Hyeon | $399,000 | |
| Previous Owner | Zaiser Michael J | $268,100 |
Source: Public Records
Tax History Compared to Growth
Tax History
| Year | Tax Paid | Tax Assessment Tax Assessment Total Assessment is a certain percentage of the fair market value that is determined by local assessors to be the total taxable value of land and additions on the property. | Land | Improvement |
|---|---|---|---|---|
| 2025 | $5,498 | $463,067 | $295,947 | $167,120 |
| 2024 | $5,413 | $453,989 | $290,145 | $163,844 |
| 2023 | $5,413 | $445,088 | $284,456 | $160,632 |
| 2022 | $5,307 | $436,362 | $278,879 | $157,483 |
| 2021 | $5,130 | $427,807 | $273,411 | $154,396 |
| 2020 | $5,003 | $423,421 | $270,608 | $152,813 |
| 2019 | $4,929 | $415,119 | $265,302 | $149,817 |
| 2018 | $4,865 | $406,980 | $260,100 | $146,880 |
| 2017 | $4,546 | $395,000 | $225,000 | $170,000 |
| 2016 | $4,220 | $365,000 | $215,000 | $150,000 |
| 2015 | $4,118 | $313,000 | $180,000 | $133,000 |
| 2014 | $3,690 | $280,000 | $160,000 | $120,000 |
Source: Public Records
Map
Nearby Homes
- 436 Calle Alto St
- 437 Calle Alto St
- 3630 Lorraine Way
- 607 30th St
- 3800 Mira Vista Way
- 686 Prosecco Ln
- 375 Villa Lots Rd
- 2182 Gamay Ln
- 686 Ingalls Ct
- 325 Fairview Ln
- 2561 Pasadena Ln
- 2563 Pasadena Ln
- 2564 Alameda Dr
- 0 Nacimiento Lake Dr Unit NS25227175
- 0 Nacimiento Lake Dr Unit NS25227132
- 102 Glencrest Ln
- 2650 Benicia Ln
- 2663 Willits Ln
- 2747 Traditions Loop
- 699 Waterford Ct
- 3619 Vine St
- 3617 Vine St Unit 11
- 3617 Vine St
- 3615 Vine St Unit 10
- 3615 Vine St
- 3613 Vine St Unit 9
- 3613 Vine St
- 506 Fein Ave Unit A,B,C
- 506 Fein Ave
- 3616 Vine St
- 3611 Vine St Unit 8
- 3611 Vine St
- 3614 Vine St
- 507 Fein Ave
- 512 Fein Ave Unit B
- 515 Fein Ave
- 3609 Vine St Unit 7
- 3609 Vine St
- 517 Sims Ave
- 534 Fein Ave