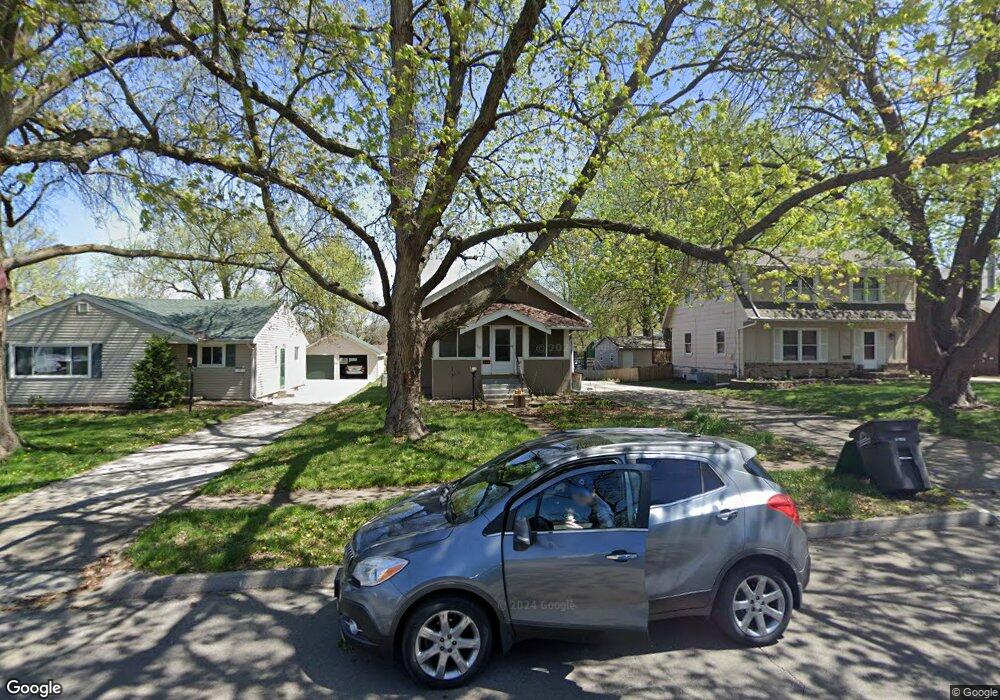
3627 49th St Des Moines, IA 50310
Beaverdale NeighborhoodEstimated Value: $202,000 - $236,646
2
Beds
1
Bath
1,040
Sq Ft
$214/Sq Ft
Est. Value
About This Home
This home is located at 3627 49th St, Des Moines, IA 50310 and is currently estimated at $222,912, approximately $214 per square foot. 3627 49th St is a home located in Polk County with nearby schools including Moore Elementary School, Meredith Middle School, and Hoover High School.
Ownership History
Date
Name
Owned For
Owner Type
Purchase Details
Closed on
Aug 5, 2015
Sold by
Thorn William R and Thorn Sarah Fiedler
Bought by
Strix Varia Llc
Current Estimated Value
Purchase Details
Closed on
Jul 14, 2015
Sold by
Schrodt Stephen and Schrodt Carol King
Bought by
Thorn William R and Thorn Sarah Fiedler
Purchase Details
Closed on
Oct 25, 2002
Sold by
Peterson Steven L and Peterson Tammy L
Bought by
Schrodt Stephen
Home Financials for this Owner
Home Financials are based on the most recent Mortgage that was taken out on this home.
Original Mortgage
$104,975
Interest Rate
6.18%
Purchase Details
Closed on
Sep 18, 2002
Sold by
Peterson Steve
Bought by
Peterson Steven L and Peterson Tammy L
Home Financials for this Owner
Home Financials are based on the most recent Mortgage that was taken out on this home.
Original Mortgage
$104,975
Interest Rate
6.18%
Create a Home Valuation Report for This Property
The Home Valuation Report is an in-depth analysis detailing your home's value as well as a comparison with similar homes in the area
Home Values in the Area
Average Home Value in this Area
Purchase History
| Date | Buyer | Sale Price | Title Company |
|---|---|---|---|
| Strix Varia Llc | -- | Attorney | |
| Thorn William R | $124,000 | Attorney | |
| Schrodt Stephen | $123,000 | -- | |
| Peterson Steven L | -- | -- |
Source: Public Records
Mortgage History
| Date | Status | Borrower | Loan Amount |
|---|---|---|---|
| Previous Owner | Schrodt Stephen | $104,975 |
Source: Public Records
Tax History Compared to Growth
Tax History
| Year | Tax Paid | Tax Assessment Tax Assessment Total Assessment is a certain percentage of the fair market value that is determined by local assessors to be the total taxable value of land and additions on the property. | Land | Improvement |
|---|---|---|---|---|
| 2025 | $4,166 | $235,600 | $55,500 | $180,100 |
| 2024 | $4,166 | $211,800 | $49,300 | $162,500 |
| 2023 | $4,196 | $211,800 | $49,300 | $162,500 |
| 2022 | $4,164 | $178,000 | $42,800 | $135,200 |
| 2021 | $4,098 | $178,000 | $42,800 | $135,200 |
| 2020 | $4,256 | $164,200 | $39,400 | $124,800 |
| 2019 | $3,918 | $164,200 | $39,400 | $124,800 |
| 2018 | $3,878 | $145,800 | $34,300 | $111,500 |
| 2017 | $3,640 | $145,800 | $34,300 | $111,500 |
| 2016 | $3,162 | $134,600 | $31,300 | $103,300 |
| 2015 | $3,162 | $120,000 | $31,300 | $88,700 |
| 2014 | $3,454 | $130,000 | $27,300 | $102,700 |
Source: Public Records
Map
Nearby Homes