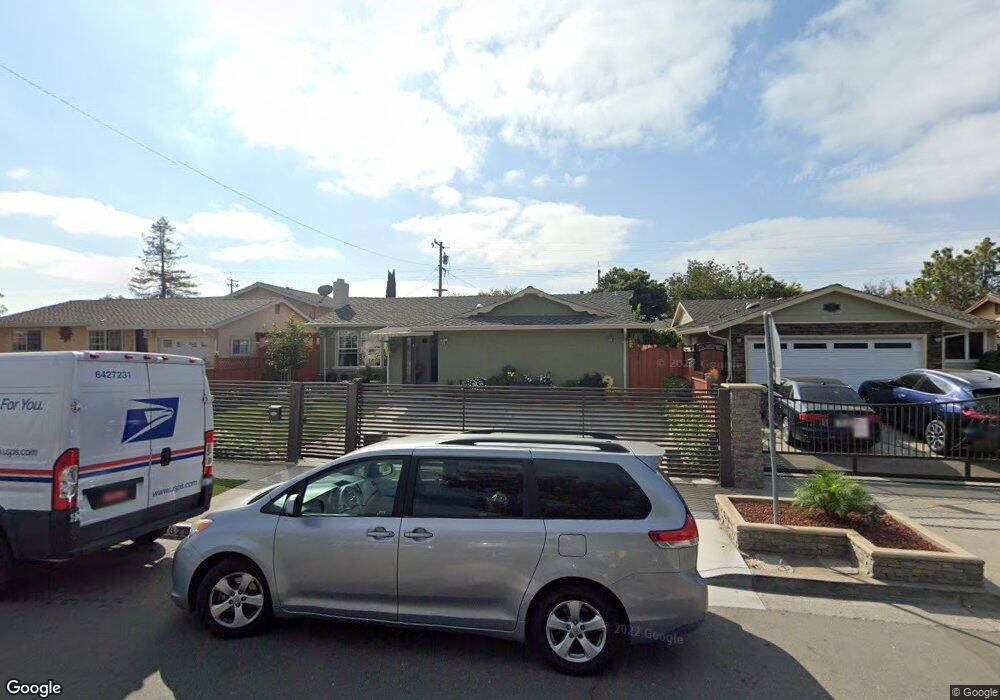
3629 Pitcairn Way San Jose, CA 95111
Hellyer NeighborhoodEstimated Value: $1,124,000 - $1,162,000
3
Beds
2
Baths
1,262
Sq Ft
$913/Sq Ft
Est. Value
About This Home
This home is located at 3629 Pitcairn Way, San Jose, CA 95111 and is currently estimated at $1,152,183, approximately $912 per square foot. 3629 Pitcairn Way is a home located in Santa Clara County with nearby schools including G.W. Hellyer Elementary School, Sylvandale Middle School, and Andrew P. Hill High School.
Ownership History
Date
Name
Owned For
Owner Type
Purchase Details
Closed on
Jun 8, 2005
Sold by
Gonzalez Luis E and Terrezas Maria G
Bought by
Terrazas Maria G
Current Estimated Value
Home Financials for this Owner
Home Financials are based on the most recent Mortgage that was taken out on this home.
Original Mortgage
$450,000
Outstanding Balance
$234,322
Interest Rate
5.72%
Mortgage Type
Stand Alone First
Estimated Equity
$917,861
Purchase Details
Closed on
May 23, 2003
Sold by
Ocana Melquiades B
Bought by
Gonzalez Luis E and Terrazas Maria G
Home Financials for this Owner
Home Financials are based on the most recent Mortgage that was taken out on this home.
Original Mortgage
$352,000
Interest Rate
5.95%
Mortgage Type
Purchase Money Mortgage
Purchase Details
Closed on
Jun 28, 2001
Sold by
Gonzalez Luis
Bought by
Ocana Melquiades B
Home Financials for this Owner
Home Financials are based on the most recent Mortgage that was taken out on this home.
Original Mortgage
$314,500
Interest Rate
7.09%
Create a Home Valuation Report for This Property
The Home Valuation Report is an in-depth analysis detailing your home's value as well as a comparison with similar homes in the area
Home Values in the Area
Average Home Value in this Area
Purchase History
| Date | Buyer | Sale Price | Title Company |
|---|---|---|---|
| Terrazas Maria G | $217,000 | North American Title Company | |
| Gonzalez Luis E | $440,000 | Alliance Title Company | |
| Ocana Melquiades B | -- | Alliance Title Company | |
| Ocana Melquiades B | $393,500 | Alliance Title Company |
Source: Public Records
Mortgage History
| Date | Status | Borrower | Loan Amount |
|---|---|---|---|
| Open | Terrazas Maria G | $450,000 | |
| Previous Owner | Gonzalez Luis E | $352,000 | |
| Previous Owner | Ocana Melquiades B | $314,500 | |
| Closed | Ocana Melquiades B | $78,600 | |
| Closed | Gonzalez Luis E | $88,000 |
Source: Public Records
Tax History Compared to Growth
Tax History
| Year | Tax Paid | Tax Assessment Tax Assessment Total Assessment is a certain percentage of the fair market value that is determined by local assessors to be the total taxable value of land and additions on the property. | Land | Improvement |
|---|---|---|---|---|
| 2025 | $11,389 | $789,043 | $353,223 | $435,820 |
| 2024 | $11,389 | $773,573 | $346,298 | $427,275 |
| 2023 | $11,257 | $758,406 | $339,508 | $418,898 |
| 2022 | $11,006 | $743,536 | $332,851 | $410,685 |
| 2021 | $10,979 | $728,958 | $326,325 | $402,633 |
| 2020 | $10,646 | $721,484 | $322,979 | $398,505 |
| 2019 | $10,214 | $707,339 | $316,647 | $390,692 |
| 2018 | $10,214 | $693,471 | $310,439 | $383,032 |
| 2017 | $10,084 | $679,874 | $304,352 | $375,522 |
| 2016 | $8,453 | $578,000 | $258,700 | $319,300 |
| 2015 | $7,626 | $518,000 | $231,900 | $286,100 |
| 2014 | $6,294 | $442,000 | $197,900 | $244,100 |
Source: Public Records
Map
Nearby Homes
- 3535 Pitcairn Way
- 573 Bamboo Ct
- 3461 Senter Rd
- 491 Ginkgo Ct
- 403 Mignot Ln
- 572 Groth Dr
- 3283 Leafwood Ln
- 3128 Shofner Place
- 407 Aires Ln
- 523 Sieber Place
- 425 Carpentier Way
- 4016 San Bernardino Way
- 4219 Senter Rd
- 4171 Ambler Way
- 3814 Seven Trees Blvd
- 3843 Marfrance Dr
- 3891 Marfrance Dr
- 13014 Water St
- 96 Rancho Dr Unit B
- 171 Kenbrook Cir
- 3635 Pitcairn Way
- 3621 Pitcairn Way
- 3615 Pitcairn Way
- 641 Sylvandale Ave
- 637 Sylvandale Ave
- 645 Sylvandale Ave
- 633 Sylvandale Ave
- 3595 Bayou Dr
- 3609 Pitcairn Way
- 649 Sylvandale Ave
- 629 Sylvandale Ave
- 3583 Bayou Dr
- 3596 Verdi Dr
- 3571 Bayou Dr
- 3760 Ashton Ln
- 3599 Pitcairn Way
- 3588 Verdi Dr
- 621 Sylvandale Ave
- 3761 Masters Ct
- 3763 Ashton Ln