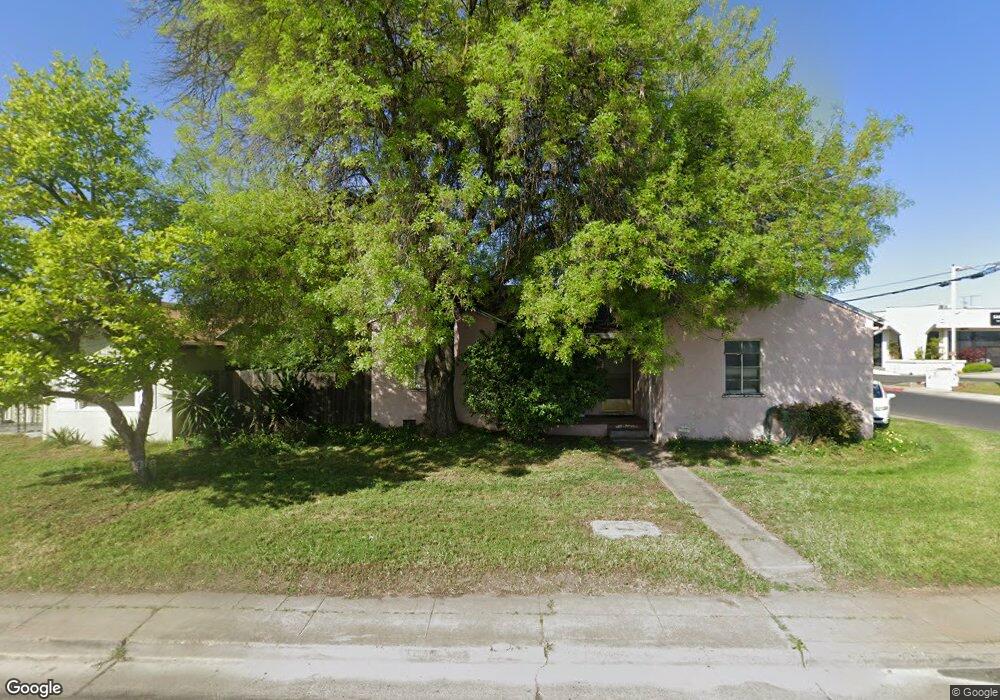
3629 West Ln Stockton, CA 95204
Midtown NeighborhoodEstimated Value: $293,000 - $437,000
4
Beds
2
Baths
1,736
Sq Ft
$217/Sq Ft
Est. Value
About This Home
This home is located at 3629 West Ln, Stockton, CA 95204 and is currently estimated at $377,415, approximately $217 per square foot. 3629 West Ln is a home located in San Joaquin County with nearby schools including Harrison Elementary School, Grunsky Elementary School, and August Elementary School.
Ownership History
Date
Name
Owned For
Owner Type
Purchase Details
Closed on
Feb 13, 2004
Sold by
Crockett Senishen Carrie
Bought by
Senishen Stephen
Current Estimated Value
Purchase Details
Closed on
May 17, 2002
Sold by
Senishen Phyllis Lee and Phyllis Lee Senishen Family Tr
Bought by
Senishen Phyllis L
Home Financials for this Owner
Home Financials are based on the most recent Mortgage that was taken out on this home.
Original Mortgage
$56,000
Outstanding Balance
$23,530
Interest Rate
6.86%
Estimated Equity
$353,885
Purchase Details
Closed on
Apr 14, 1999
Sold by
Senishen Phyllis
Bought by
Senishen Phyllis Lee and Phyllis Lee Senishen Family Tr
Purchase Details
Closed on
Nov 19, 1993
Sold by
Senishen Phyllis
Bought by
Senishen Peter M and Senishen Phyllis
Home Financials for this Owner
Home Financials are based on the most recent Mortgage that was taken out on this home.
Original Mortgage
$32,000
Interest Rate
6.74%
Create a Home Valuation Report for This Property
The Home Valuation Report is an in-depth analysis detailing your home's value as well as a comparison with similar homes in the area
Home Values in the Area
Average Home Value in this Area
Purchase History
| Date | Buyer | Sale Price | Title Company |
|---|---|---|---|
| Senishen Stephen | -- | -- | |
| Senishen Phyllis L | -- | -- | |
| Senishen Phyllis L | -- | Fidelity National Title Ins | |
| Senishen Phyllis Lee | -- | -- | |
| Senishen Phyllis Lee | -- | -- | |
| Senishen Peter M | -- | Chicago Title Company |
Source: Public Records
Mortgage History
| Date | Status | Borrower | Loan Amount |
|---|---|---|---|
| Open | Senishen Phyllis L | $56,000 | |
| Closed | Senishen Peter M | $32,000 |
Source: Public Records
Tax History Compared to Growth
Tax History
| Year | Tax Paid | Tax Assessment Tax Assessment Total Assessment is a certain percentage of the fair market value that is determined by local assessors to be the total taxable value of land and additions on the property. | Land | Improvement |
|---|---|---|---|---|
| 2025 | $1,816 | $81,273 | $19,079 | $62,194 |
| 2024 | $1,724 | $79,680 | $18,705 | $60,975 |
| 2023 | $1,067 | $78,119 | $18,339 | $59,780 |
| 2022 | $1,023 | $76,588 | $17,980 | $58,608 |
| 2021 | $985 | $75,087 | $17,628 | $57,459 |
| 2020 | $1,002 | $74,318 | $17,448 | $56,870 |
| 2019 | $998 | $72,861 | $17,106 | $55,755 |
| 2018 | $991 | $71,433 | $16,771 | $54,662 |
| 2017 | $942 | $70,034 | $16,443 | $53,591 |
| 2016 | $854 | $68,660 | $16,120 | $52,540 |
| 2014 | $914 | $66,305 | $15,567 | $50,738 |
Source: Public Records
Map
Nearby Homes
- 3611 West Ln
- 3537 West Ln
- 3704 San Rafael Ave
- 3515 Carly Dr
- 3984 Monique Cir
- 1771 Fontanella Way
- 1829 Mighty Oak Dr
- 746 Wright Ave
- 705 E Barrymore St
- 4028 Trieste Cir
- 4233 Verdant St
- 833 E Essex St
- 547 E Atlee St
- 2036 Mighty Oak Dr
- The Discovery Plan at Calaveras Place
- 908 Terranova Ct
- 705 Spirou St
- 4450 Oakfield Dr
- 467 E Churchill St
- 480 E Monterey Ave
- 3621 West Ln
- 3630 Sierra Madre Ave
- 3622 Sierra Madre Ave
- 3614 Sierra Madre Ave
- 3605 West Ln
- 3604 Sierra Madre Ave
- 3640 West Ln
- 3630 West Ln
- 3614 West Ln
- 3540 Sierra Madre Ave
- 3736 West Ln
- 3610 West Ln
- 3529 West Ln
- 3740 West Ln
- 3629 Sierra Madre Ave
- 3530 Sierra Madre Ave
- 3621 Sierra Madre Ave
- 3540 West Ln
- 3611 Sierra Madre Ave
- 3519 West Ln