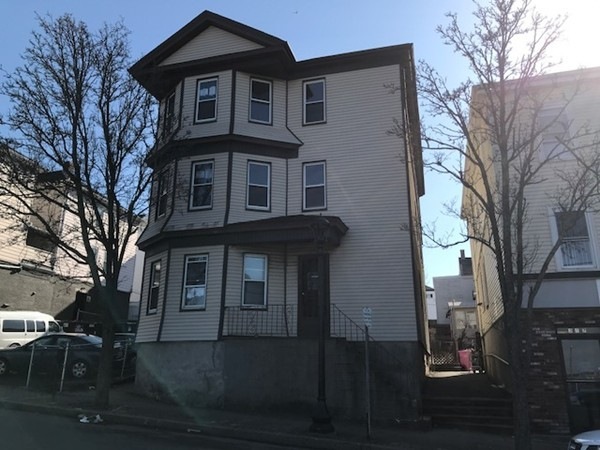
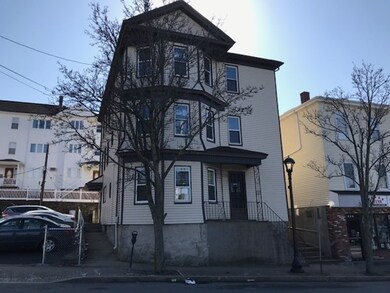

363 Columbia St Fall River, MA 02721
Sandy Beach NeighborhoodAbout This Home
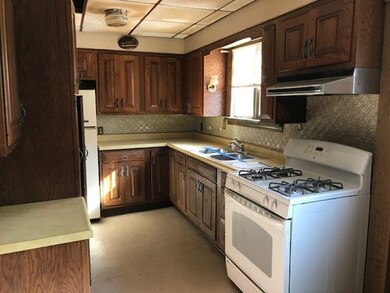
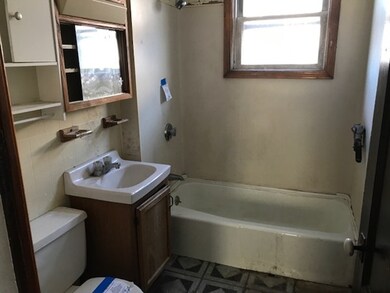
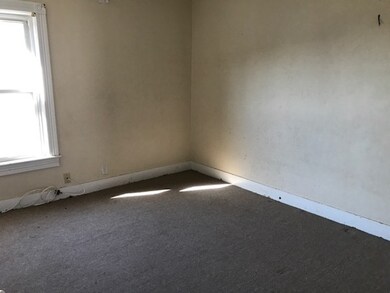
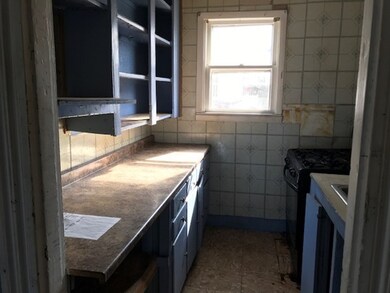
As of November 2018Large Fall River 3 family property located in the heart Fall River. Large apartments, large bedrooms, open floor plan and endless possibilities. Well worth the investment as an owner occupant or investor. Property is NOT located in a FEMA Special Flood Hazard Area but is listed as a moderate to low flood risk. Repairs exceed $10,000. Repairs may include but not limited to structure, electrical, roof, HVAC, and plumbing; Inspection recommended, Needed Repairs: Repair damaged concrete steps and walkway. Exterior and interior defective paint repairs needed. Repair all damaged ceilings. Repair damaged electrical light fixtures. Install new vinyl flooring in unit 1.Replace moldy vanity and drywall in unit 1. Replace carpets throughout. Repair damaged ceramic tile in unit 1, 3 units. Selling Broker up to 3% of purchase price, Misc.: UI-Eligible for 203K Financing. Financing Terms: FHA, Cash, Conventional, 203K financing

Last Buyer's Agent
Charles O'Gara
Amaral & Associates RE
Property Details
Home Type
- Multi-Family
Est. Annual Taxes
- $5,883
Year Built
- Built in 1900
Additional Features
- Basement
Listing and Financial Details
- Assessor Parcel Number M:0I-07 B:0000 L:0013
Ownership History
Purchase Details
Home Financials for this Owner
Home Financials are based on the most recent Mortgage that was taken out on this home.Purchase Details
Map
Home Values in the Area
Average Home Value in this Area
Purchase History
| Date | Type | Sale Price | Title Company |
|---|---|---|---|
| Warranty Deed | $139,000 | -- | |
| Foreclosure Deed | $376,151 | -- |
Mortgage History
| Date | Status | Loan Amount | Loan Type |
|---|---|---|---|
| Open | $260,200 | FHA | |
| Previous Owner | $56,232 | No Value Available | |
| Previous Owner | $48,788 | No Value Available | |
| Previous Owner | $42,776 | No Value Available | |
| Previous Owner | $29,500 | No Value Available |
Property History
| Date | Event | Price | Change | Sq Ft Price |
|---|---|---|---|---|
| 11/13/2018 11/13/18 | Sold | $265,000 | +2.0% | $76 / Sq Ft |
| 09/20/2018 09/20/18 | Pending | -- | -- | -- |
| 08/24/2018 08/24/18 | For Sale | $259,900 | +87.0% | $75 / Sq Ft |
| 05/04/2018 05/04/18 | Sold | $139,000 | -0.7% | $40 / Sq Ft |
| 03/19/2018 03/19/18 | Pending | -- | -- | -- |
| 03/16/2018 03/16/18 | For Sale | $140,000 | 0.0% | $40 / Sq Ft |
| 03/14/2018 03/14/18 | Pending | -- | -- | -- |
| 03/06/2018 03/06/18 | For Sale | $140,000 | -- | $40 / Sq Ft |
Tax History
| Year | Tax Paid | Tax Assessment Tax Assessment Total Assessment is a certain percentage of the fair market value that is determined by local assessors to be the total taxable value of land and additions on the property. | Land | Improvement |
|---|---|---|---|---|
| 2025 | $5,883 | $513,800 | $105,200 | $408,600 |
| 2024 | $5,627 | $489,700 | $101,300 | $388,400 |
| 2023 | $4,936 | $402,300 | $83,700 | $318,600 |
| 2022 | $4,368 | $346,100 | $79,700 | $266,400 |
| 2021 | $4,112 | $297,300 | $75,800 | $221,500 |
| 2020 | $3,678 | $254,500 | $74,700 | $179,800 |
| 2019 | $3,107 | $213,100 | $71,900 | $141,200 |
| 2018 | $2,981 | $203,900 | $77,900 | $126,000 |
| 2017 | $2,804 | $200,300 | $74,300 | $126,000 |
| 2016 | $2,749 | $201,700 | $79,000 | $122,700 |
| 2015 | $2,575 | $196,900 | $79,000 | $117,900 |
| 2014 | $2,597 | $206,400 | $76,700 | $129,700 |
Source: MLS Property Information Network (MLS PIN)
MLS Number: 72289976
APN: FALL-000007I-000000-000013
Disclaimer: Certain information contained herein is derived from information provided by parties other than Homes.com. All information provided is deemed reliable, but is not guaranteed to be accurate and should be independently verified.
![]() The property listing data and information, or the Images, set forth herein were provided to MLS Property Information Network, Inc. from third party sources, including sellers, lessors and public records, and were compiled by MLS Property Information Network, Inc. The property listing data and information, and the Images, are for the personal, non-commercial use of consumers having a good faith interest in purchasing or leasing listed properties of the type displayed to them and may not be used for any purpose other than to identify prospective properties which such consumers may have a good faith interest in purchasing or leasing. MLS Property Information Network, Inc. and its subscribers disclaim any and all representations and warranties as to the accuracy of the property listing data and information, or as to the accuracy of any of the Images, set forth herein.
The property listing data and information, or the Images, set forth herein were provided to MLS Property Information Network, Inc. from third party sources, including sellers, lessors and public records, and were compiled by MLS Property Information Network, Inc. The property listing data and information, and the Images, are for the personal, non-commercial use of consumers having a good faith interest in purchasing or leasing listed properties of the type displayed to them and may not be used for any purpose other than to identify prospective properties which such consumers may have a good faith interest in purchasing or leasing. MLS Property Information Network, Inc. and its subscribers disclaim any and all representations and warranties as to the accuracy of the property listing data and information, or as to the accuracy of any of the Images, set forth herein.