Estimated Value: $143,005 - $184,000
Studio
--
Bath
3,104
Sq Ft
$53/Sq Ft
Est. Value
About This Home
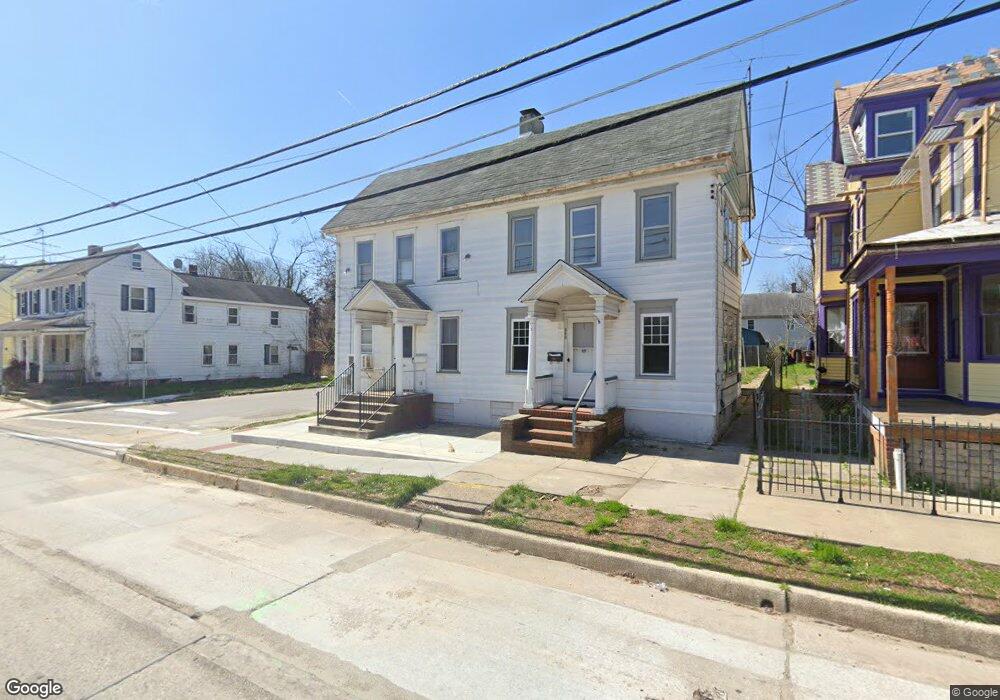
This home is located at 363 E Broadway Unit 365, Salem, NJ 08079 and is currently estimated at $164,501, approximately $52 per square foot. 363 E Broadway Unit 365 is a home located in Salem County with nearby schools including John Fenwick Elementary School, Salem Middle School, and Salem High School.
Ownership History
Date
Name
Owned For
Owner Type
Purchase Details
Closed on
May 22, 2024
Sold by
232 Frederick Avenue Llc
Bought by
Sjh Homes Llc
Current Estimated Value
Purchase Details
Closed on
Jan 30, 2023
Sold by
Sini Properties Llc
Bought by
232 Frederick Avenue Llc
Purchase Details
Closed on
Jan 3, 2020
Sold by
Hemple Dale R Est
Bought by
Klein Brian and Cunningham David C
Purchase Details
Closed on
Jan 7, 1986
Bought by
Hemple Dale R and Hemple Ena
Create a Home Valuation Report for This Property
The Home Valuation Report is an in-depth analysis detailing your home's value as well as a comparison with similar homes in the area
Home Values in the Area
Average Home Value in this Area
Purchase History
| Date | Buyer | Sale Price | Title Company |
|---|---|---|---|
| Sjh Homes Llc | $120,000 | Dekel Abstract | |
| Sjh Homes Llc | $120,000 | Dekel Abstract | |
| 232 Frederick Avenue Llc | $61,000 | Salem Oak Title | |
| Klein Brian | $30,000 | None Available | |
| Hemple Dale R | -- | -- |
Source: Public Records
Tax History
| Year | Tax Paid | Tax Assessment Tax Assessment Total Assessment is a certain percentage of the fair market value that is determined by local assessors to be the total taxable value of land and additions on the property. | Land | Improvement |
|---|---|---|---|---|
| 2025 | $4,670 | $56,800 | $7,800 | $49,000 |
| 2024 | $4,465 | $56,800 | $7,800 | $49,000 |
Source: Public Records
Map
Nearby Homes
Your Personal Tour Guide
Ask me questions while you tour the home.