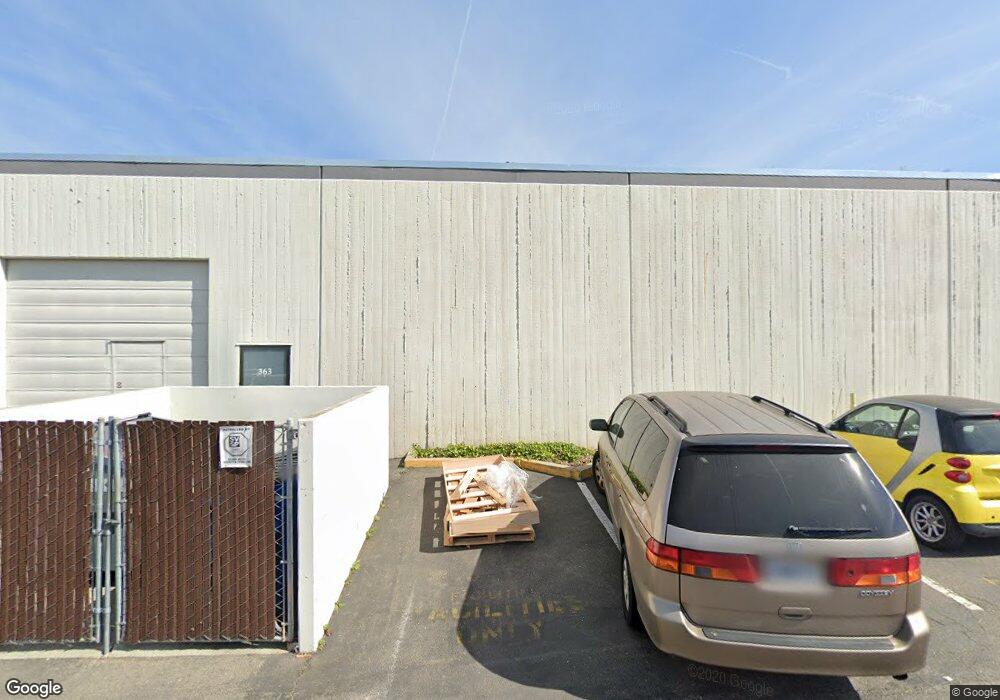
363 Fairview Way Milpitas, CA 95035
Estimated Value: $1,530,193
--
Bed
--
Bath
4,021
Sq Ft
$381/Sq Ft
Est. Value
About This Home
This home is located at 363 Fairview Way, Milpitas, CA 95035 and is currently estimated at $1,530,193, approximately $380 per square foot. 363 Fairview Way is a home located in Santa Clara County with nearby schools including Joseph Weller Elementary School, Thomas Russell Middle School, and Milpitas High School.
Ownership History
Date
Name
Owned For
Owner Type
Purchase Details
Closed on
May 31, 2012
Sold by
Donton Construction Inc
Bought by
Corasia Corporation
Current Estimated Value
Purchase Details
Closed on
Mar 11, 2010
Sold by
Homecomers Rcc Inc
Bought by
Donton Construction Inc
Purchase Details
Closed on
Dec 4, 2009
Sold by
Ghai Surjit S and Ghai Tina J
Bought by
Homecomers Rcc Inc
Purchase Details
Closed on
Aug 8, 2007
Sold by
Stonewood Dixon Llc
Bought by
Ghai Surjit S and Ghai Tina J
Home Financials for this Owner
Home Financials are based on the most recent Mortgage that was taken out on this home.
Original Mortgage
$649,000
Interest Rate
6.62%
Mortgage Type
Commercial
Create a Home Valuation Report for This Property
The Home Valuation Report is an in-depth analysis detailing your home's value as well as a comparison with similar homes in the area
Home Values in the Area
Average Home Value in this Area
Purchase History
| Date | Buyer | Sale Price | Title Company |
|---|---|---|---|
| Corasia Corporation | $550,000 | Old Republic Title Company | |
| Donton Construction Inc | $332,500 | Old Republic Title Company | |
| Homecomers Rcc Inc | $301,800 | None Available | |
| Ghai Surjit S | $764,000 | Chicago Title Company |
Source: Public Records
Mortgage History
| Date | Status | Borrower | Loan Amount |
|---|---|---|---|
| Previous Owner | Ghai Surjit S | $649,000 |
Source: Public Records
Tax History Compared to Growth
Tax History
| Year | Tax Paid | Tax Assessment Tax Assessment Total Assessment is a certain percentage of the fair market value that is determined by local assessors to be the total taxable value of land and additions on the property. | Land | Improvement |
|---|---|---|---|---|
| 2025 | $8,156 | $690,818 | $488,599 | $202,219 |
| 2024 | $8,156 | $677,273 | $479,019 | $198,254 |
| 2023 | $8,128 | $663,994 | $469,627 | $194,367 |
| 2022 | $8,102 | $650,975 | $460,419 | $190,556 |
| 2021 | $7,983 | $638,212 | $451,392 | $186,820 |
| 2020 | $7,844 | $631,669 | $446,764 | $184,905 |
| 2019 | $7,759 | $619,284 | $438,004 | $181,280 |
| 2018 | $7,375 | $607,142 | $429,416 | $177,726 |
| 2017 | $7,280 | $595,239 | $420,997 | $174,242 |
| 2016 | $6,989 | $583,569 | $412,743 | $170,826 |
| 2015 | $6,914 | $574,805 | $406,544 | $168,261 |
| 2014 | $6,729 | $563,546 | $398,581 | $164,965 |
Source: Public Records
Map
Nearby Homes
- 1200 N Abbott Ave Unit 200
- 1206 California Cir
- 1375 California Cir
- 1377 California Cir
- 1361 Lilac Way
- 1355 Lilac Way
- 1087 N Abbott Ave
- 1048 N Abbott Ave
- 392 Terra Mesa Way
- 468 Glenmoor Cir
- 1610 Hidden Creek Ln
- 479 Chestnut Ave
- 207 Redwood Ave
- 99 Jacklin Ct
- 559 Walnut Dr
- 182 Rose Dr
- 386 Heath St
- 60 Wilson Way Unit 171
- 60 Wilson Way Unit 150
- 60 Wilson Way Unit 158
- 359 Fairview Way
- 342 Fairview Way
- 375 Fairview Way
- 316 Fairview Way
- 355 Fairview Way
- 312 Fairview Way
- 300 Fairview Way
- 280 Fairview Way
- 1108 California Cir
- 1120 California Cir
- 1110 California Cir
- 1110 California Cir
- 1128 California Cir
- 1112 California Cir
- 1122 California Cir
- 1126 California Cir
- 1130 California Cir
- 1132 California Cir
- 0 Desert Holly St
- 1136 California Cir