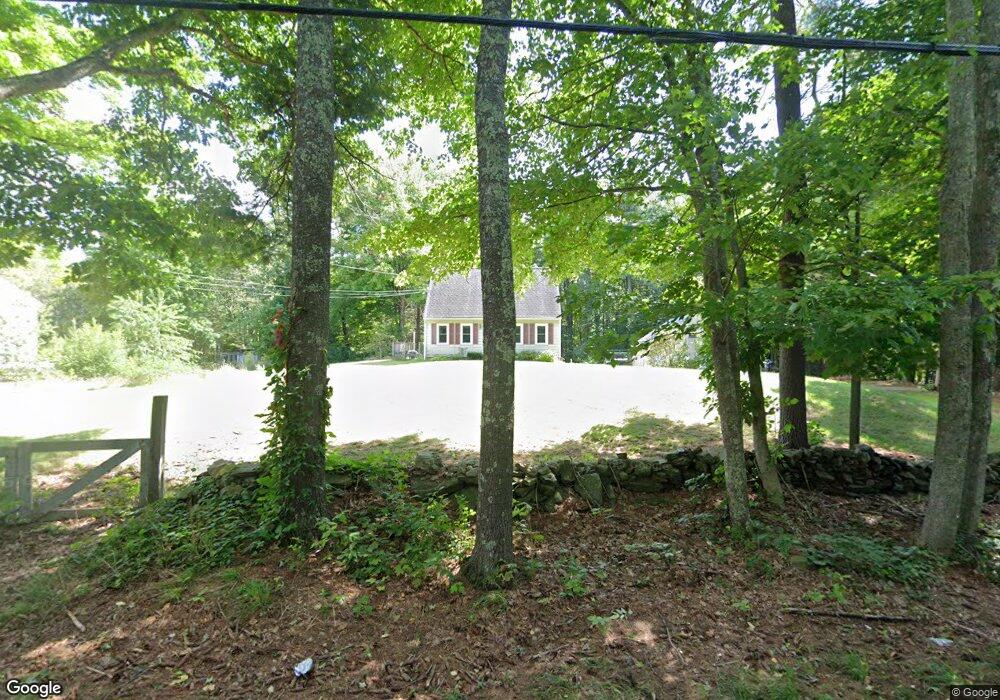
363 North Rd Fremont, NH 03044
Estimated Value: $462,000 - $624,000
3
Beds
2
Baths
1,456
Sq Ft
$376/Sq Ft
Est. Value
About This Home
This home is located at 363 North Rd, Fremont, NH 03044 and is currently estimated at $547,834, approximately $376 per square foot. 363 North Rd is a home located in Rockingham County with nearby schools including Ellis School.
Ownership History
Date
Name
Owned For
Owner Type
Purchase Details
Closed on
Dec 28, 2020
Sold by
Hunter Brett A
Bought by
Hunter Brett A and Hunter Emelie R
Current Estimated Value
Purchase Details
Closed on
Dec 2, 1996
Sold by
Maciejowski Peter and Maciejowski Suzanne
Bought by
Hunter Brett A and Hunter Julie A
Home Financials for this Owner
Home Financials are based on the most recent Mortgage that was taken out on this home.
Original Mortgage
$105,300
Interest Rate
7.82%
Create a Home Valuation Report for This Property
The Home Valuation Report is an in-depth analysis detailing your home's value as well as a comparison with similar homes in the area
Home Values in the Area
Average Home Value in this Area
Purchase History
| Date | Buyer | Sale Price | Title Company |
|---|---|---|---|
| Hunter Brett A | -- | None Available | |
| Hunter Brett A | $117,000 | -- |
Source: Public Records
Mortgage History
| Date | Status | Borrower | Loan Amount |
|---|---|---|---|
| Previous Owner | Hunter Brett A | $24,400 | |
| Previous Owner | Hunter Brett A | $105,300 |
Source: Public Records
Tax History Compared to Growth
Tax History
| Year | Tax Paid | Tax Assessment Tax Assessment Total Assessment is a certain percentage of the fair market value that is determined by local assessors to be the total taxable value of land and additions on the property. | Land | Improvement |
|---|---|---|---|---|
| 2024 | $7,046 | $267,200 | $95,200 | $172,000 |
| 2023 | $6,303 | $267,200 | $95,200 | $172,000 |
| 2022 | $6,196 | $267,200 | $95,200 | $172,000 |
| 2021 | $6,004 | $269,000 | $95,200 | $173,800 |
| 2020 | $6,222 | $269,000 | $95,200 | $173,800 |
| 2019 | $6,806 | $219,200 | $85,400 | $133,800 |
| 2018 | $6,444 | $219,200 | $85,400 | $133,800 |
| 2017 | $6,398 | $219,200 | $85,400 | $133,800 |
| 2016 | $6,550 | $219,200 | $85,400 | $133,800 |
| 2015 | $6,357 | $219,200 | $85,400 | $133,800 |
| 2014 | $6,214 | $220,200 | $85,400 | $134,800 |
| 2013 | $6,278 | $220,200 | $85,400 | $134,800 |
Source: Public Records
Map
Nearby Homes
- 62 Lyford Ln
- 28 Leavitt Rd
- 1 Annika Lee Dr Unit B
- 266 Route 125
- 11 Three Ponds Dr
- 19 Biggs Ave Unit B
- 15 Biggs Ave Unit A
- The Laurel Plan at Pleasant View Farm
- The Ridgemont Plan at Pleasant View Farm
- The Leyland Plan at Pleasant View Farm
- The Rosewood Plan at Pleasant View Farm
- 16B Lunas Ave
- 9A Lunas Ave
- 3A Lunas Ave Unit A
- 3A Lunas Ave
- 11 Walker Rd Unit 11B
- 3 Walker Rd Unit 3A
- 1B Connor Ct Unit 1B
- 9A Connor Ct Unit 9A
- 5B Connor Ct Unit 5B