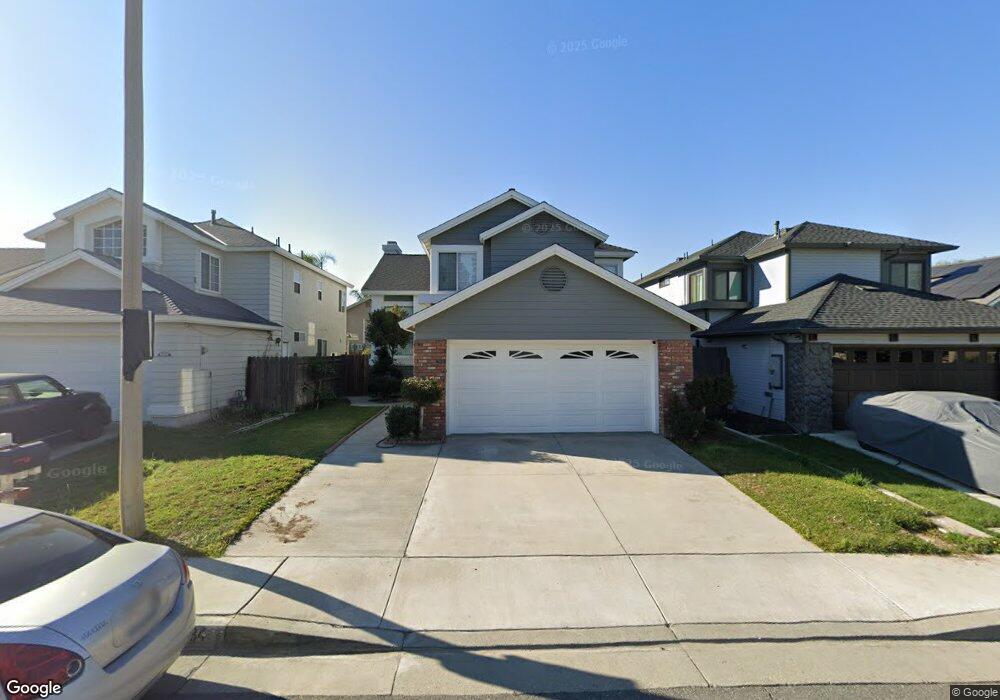
3634 Foxglen Loop Ontario, CA 91761
Ontario Ranch NeighborhoodEstimated Value: $603,000 - $679,338
3
Beds
3
Baths
1,576
Sq Ft
$405/Sq Ft
Est. Value
About This Home
This home is located at 3634 Foxglen Loop, Ontario, CA 91761 and is currently estimated at $638,335, approximately $405 per square foot. 3634 Foxglen Loop is a home located in San Bernardino County with nearby schools including Creek View Elementary School, Grace Yokley Middle School, and Colony High.
Ownership History
Date
Name
Owned For
Owner Type
Purchase Details
Closed on
May 22, 2006
Sold by
Jones John
Bought by
Jones Mahasin
Current Estimated Value
Home Financials for this Owner
Home Financials are based on the most recent Mortgage that was taken out on this home.
Original Mortgage
$336,000
Outstanding Balance
$189,913
Interest Rate
1%
Mortgage Type
Negative Amortization
Estimated Equity
$448,422
Purchase Details
Closed on
Apr 28, 2006
Sold by
Ornelas Maria Carmen
Bought by
Jones Mahasin
Home Financials for this Owner
Home Financials are based on the most recent Mortgage that was taken out on this home.
Original Mortgage
$336,000
Outstanding Balance
$189,913
Interest Rate
1%
Mortgage Type
Negative Amortization
Estimated Equity
$448,422
Purchase Details
Closed on
Apr 7, 2005
Sold by
Coley Francis
Bought by
Ornelas Sergio C and Ornelas Maria Carmen
Home Financials for this Owner
Home Financials are based on the most recent Mortgage that was taken out on this home.
Original Mortgage
$311,500
Interest Rate
6.62%
Mortgage Type
Fannie Mae Freddie Mac
Purchase Details
Closed on
Oct 29, 2004
Sold by
Garcia Jesse
Bought by
Coley Francis and Coley Cori
Home Financials for this Owner
Home Financials are based on the most recent Mortgage that was taken out on this home.
Original Mortgage
$293,600
Interest Rate
5%
Mortgage Type
Purchase Money Mortgage
Purchase Details
Closed on
Feb 22, 2001
Sold by
Community Alliance Development Inc
Bought by
Garcia Jessie and Garcia Teresa M
Home Financials for this Owner
Home Financials are based on the most recent Mortgage that was taken out on this home.
Original Mortgage
$168,850
Interest Rate
6.97%
Mortgage Type
FHA
Purchase Details
Closed on
Oct 3, 2000
Sold by
Hud
Bought by
Community Alliance Development Inc
Home Financials for this Owner
Home Financials are based on the most recent Mortgage that was taken out on this home.
Original Mortgage
$148,000
Interest Rate
7.81%
Purchase Details
Closed on
Jul 5, 2000
Sold by
Chase Manhattan Mtg Corp
Bought by
Hud
Purchase Details
Closed on
May 10, 2000
Sold by
Troope Van
Bought by
Chase Manhattan Mtg Corp
Purchase Details
Closed on
May 6, 1997
Sold by
Padilla Pedro and Padilla Carmen N
Bought by
Troope Van and Troope Delores
Home Financials for this Owner
Home Financials are based on the most recent Mortgage that was taken out on this home.
Original Mortgage
$133,345
Interest Rate
7.91%
Mortgage Type
FHA
Create a Home Valuation Report for This Property
The Home Valuation Report is an in-depth analysis detailing your home's value as well as a comparison with similar homes in the area
Home Values in the Area
Average Home Value in this Area
Purchase History
We collect this data history from publicly available records. To have your information removed, we recommend requesting removal directly through your county’s website.
| Date | Buyer | Sale Price | Title Company |
|---|---|---|---|
| Jones Mahasin | -- | Southland Title | |
| Jones Mahasin | $420,000 | Southland Title Company | |
| Ornelas Sergio C | $390,000 | Orange Coast Title | |
| Coley Francis | $367,000 | Orange Coast Title | |
| Garcia Jessie | $171,500 | Orange Coast Title | |
| Community Alliance Development Inc | $126,000 | Orange Coast Title | |
| Hud | -- | First American Title Ins | |
| Chase Manhattan Mtg Corp | $145,023 | First American Title Ins Co | |
| Troope Van | $135,000 | Northern Counties Title Co |
Source: Public Records
Mortgage History
We collect this data history from publicly available records. To have your information removed, we recommend requesting removal directly through your county’s website.
| Date | Status | Borrower | Loan Amount |
|---|---|---|---|
| Open | Jones Mahasin | $336,000 | |
| Previous Owner | Ornelas Sergio C | $311,500 | |
| Previous Owner | Coley Francis | $293,600 | |
| Previous Owner | Garcia Jessie | $168,850 | |
| Previous Owner | Community Alliance Development Inc | $148,000 | |
| Previous Owner | Troope Van | $133,345 | |
| Closed | Chase Manhattan Mtg Corp | -- | |
| Closed | Coley Francis | $55,050 |
Source: Public Records
Tax History
| Year | Tax Paid | Tax Assessment Tax Assessment Total Assessment is a certain percentage of the fair market value that is determined by local assessors to be the total taxable value of land and additions on the property. | Land | Improvement |
|---|---|---|---|---|
| 2025 | $6,021 | $573,967 | $200,889 | $373,078 |
| 2024 | $5,858 | $562,713 | $196,950 | $365,763 |
| 2023 | $5,722 | $551,679 | $193,088 | $358,591 |
| 2022 | $5,617 | $540,862 | $189,302 | $351,560 |
| 2021 | $4,982 | $475,000 | $166,000 | $309,000 |
| 2020 | $4,811 | $462,500 | $161,700 | $300,800 |
| 2019 | $4,737 | $449,000 | $157,000 | $292,000 |
| 2018 | $4,286 | $409,000 | $143,500 | $265,500 |
| 2017 | $3,914 | $380,500 | $133,500 | $247,000 |
| 2016 | $3,749 | $362,300 | $127,100 | $235,200 |
| 2015 | $3,605 | $345,000 | $121,000 | $224,000 |
| 2014 | $3,564 | $345,000 | $121,000 | $224,000 |
Source: Public Records
Map
Nearby Homes
- 2727 Eagle Creek Place
- 3652 Caribou Creek Ct
- 3918 E Cambria Privado
- 4208 S Laguna Ave
- 3642 Lytle Creek Loop Unit D
- 3706 Lytle Creek Loop
- 3736 Oak Creek Dr Unit D
- 2633 Tahoe Dr
- 3709 Country Oaks Loop Unit E
- 2864 Mill Creek Rd
- 3718 Strawberry Creek Way
- 3932 American River Rd
- 3121 E Genoa Ct Unit F
- 3201 Ashgate Way
- 3057 S Hampton Way
- 3443 E Moonstone Dr
- 3413 E Moonstone Dr
- 3425 E Moonstone Dr
- 3431 E Moonstone Dr
- 3234 S Agate Paseo
- 3630 Foxglen Loop
- 3636 Foxglen Loop
- 3626 Foxglen Loop
- 3638 Foxglen Loop
- 3633 Honey Glen Way
- 3631 Honey Glen Way
- 3635 Honey Glen Way
- 3629 Honey Glen Way
- 3640 Foxglen Loop
- 3622 Foxglen Loop
- 3637 Honey Glen Way
- 3627 Honey Glen Way
- 3633 Foxglen Loop
- 3635 Foxglen Loop
- 3631 Foxglen Loop
- 3631 Foxglen Loop
- 3637 Foxglen Loop
- 3639 Honey Glen Way
- 3642 Foxglen Loop
- 3618 Foxglen Loop
Your Personal Tour Guide
Ask me questions while you tour the home.