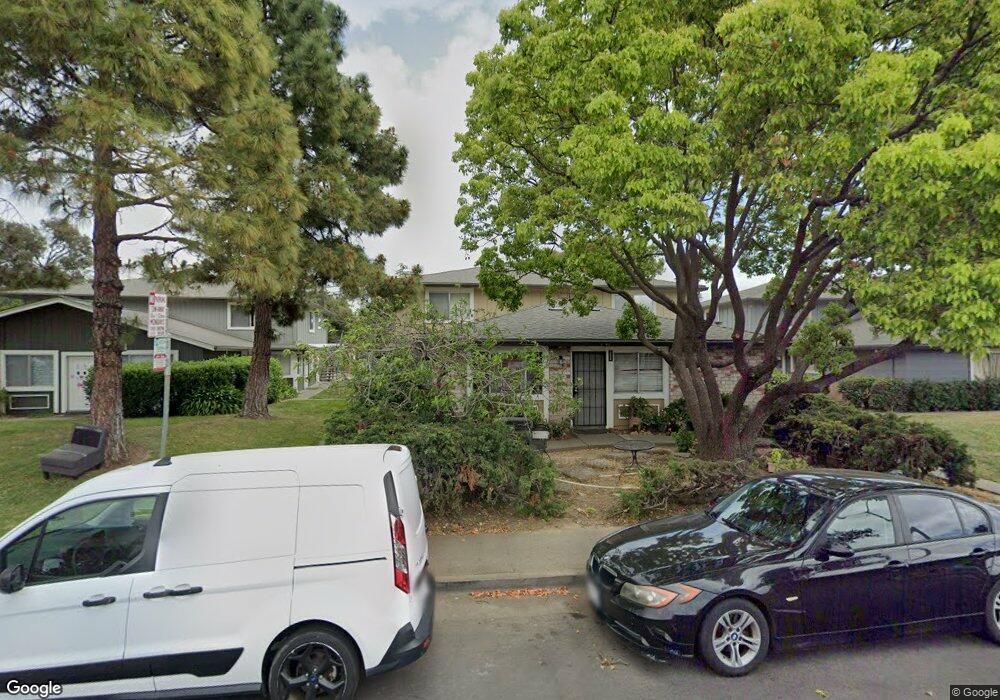
3634 Kerner Blvd Unit 4 San Rafael, CA 94901
Canal NeighborhoodEstimated Value: $389,498 - $494,000
2
Beds
1
Bath
840
Sq Ft
$512/Sq Ft
Est. Value
About This Home
This home is located at 3634 Kerner Blvd Unit 4, San Rafael, CA 94901 and is currently estimated at $430,499, approximately $512 per square foot. 3634 Kerner Blvd Unit 4 is a home located in Marin County with nearby schools including Bahia Vista Elementary School, James B. Davidson Middle School, and San Rafael High School.
Ownership History
Date
Name
Owned For
Owner Type
Purchase Details
Closed on
Nov 22, 2016
Sold by
Simonson David C and Farley Be Thi
Bought by
Ly Quang and Tran Duyen
Current Estimated Value
Home Financials for this Owner
Home Financials are based on the most recent Mortgage that was taken out on this home.
Original Mortgage
$230,000
Outstanding Balance
$185,230
Interest Rate
3.52%
Mortgage Type
Unknown
Estimated Equity
$245,269
Purchase Details
Closed on
Jan 12, 2012
Sold by
Simonson David C and Farley Be Thi
Bought by
Simonson David C and Farley Be Thi
Purchase Details
Closed on
Dec 5, 2001
Sold by
Simonson David C
Bought by
Simonson David C and Farley Be Thi
Home Financials for this Owner
Home Financials are based on the most recent Mortgage that was taken out on this home.
Original Mortgage
$150,000
Interest Rate
6.57%
Purchase Details
Closed on
May 19, 1997
Sold by
Huynh Muoi V and Huynh Thu Huong T T
Bought by
Simonson David C and Farley Be Thi
Create a Home Valuation Report for This Property
The Home Valuation Report is an in-depth analysis detailing your home's value as well as a comparison with similar homes in the area
Home Values in the Area
Average Home Value in this Area
Purchase History
| Date | Buyer | Sale Price | Title Company |
|---|---|---|---|
| Ly Quang | $280,000 | Old Republic Title Co | |
| Simonson David C | -- | None Available | |
| Simonson David C | -- | -- | |
| Simonson David C | $75,000 | Alliance Title Company | |
| Simonson David C | $95,000 | -- |
Source: Public Records
Mortgage History
| Date | Status | Borrower | Loan Amount |
|---|---|---|---|
| Open | Ly Quang | $230,000 | |
| Previous Owner | Simonson David C | $150,000 |
Source: Public Records
Tax History Compared to Growth
Tax History
| Year | Tax Paid | Tax Assessment Tax Assessment Total Assessment is a certain percentage of the fair market value that is determined by local assessors to be the total taxable value of land and additions on the property. | Land | Improvement |
|---|---|---|---|---|
| 2025 | $5,725 | $324,956 | $162,478 | $162,478 |
| 2024 | $5,725 | $318,586 | $159,293 | $159,293 |
| 2023 | $5,563 | $312,340 | $156,170 | $156,170 |
| 2022 | $5,307 | $306,216 | $153,108 | $153,108 |
| 2021 | $5,223 | $300,212 | $150,106 | $150,106 |
| 2020 | $5,132 | $297,136 | $148,568 | $148,568 |
| 2019 | $4,948 | $291,312 | $145,656 | $145,656 |
| 2018 | $4,892 | $285,600 | $142,800 | $142,800 |
| 2017 | $4,728 | $280,000 | $140,000 | $140,000 |
| 2016 | $2,744 | $110,060 | $27,515 | $82,545 |
| 2015 | $2,629 | $108,406 | $27,101 | $81,305 |
| 2014 | $2,492 | $106,284 | $26,571 | $79,713 |
Source: Public Records
Map
Nearby Homes
- 3665 Kerner Blvd Unit B
- 3665 Kerner Blvd Unit D
- 22 Fairfax St Unit B
- 35 Fairfax St Unit 8
- 199 Canal St Unit 6
- 231 Playa Del Rey
- 163 Bahia Cir
- 120 Canal St
- 20 Porto Bello Dr
- 29 Porto Bello Dr
- 9 Porto Bello Dr
- 48 Porto Bello Dr
- 80 Baypoint Dr
- 139 Nantucket Cove
- 110 Baypoint Dr Unit 2
- 21 Marina Blvd
- 55 Dowitcher Way
- 56 Mooring Rd Unit 2
- 124 Baypoint Dr
- 13 Hingham Cove
- 3630 Kerner Blvd Unit 2
- 3632 Kerner Blvd
- 3638 Kerner Blvd
- 3624 Kerner Blvd
- 3626 Kerner Blvd Unit 4
- 3642 Kerner Blvd
- 3620 Kerner Blvd Unit 1
- 3622 Kerner Blvd
- 3640 Kerner Blvd
- 3648 Kerner Blvd
- 3650 Kerner Blvd
- 3644 Kerner Blvd
- 3646 Kerner Blvd
- 497 Bahia Way
- 487 Bahia Way
- 271 Bahia Place
- 493 Bahia Way
- 495 Bahia Way
- 263 Bahia Place