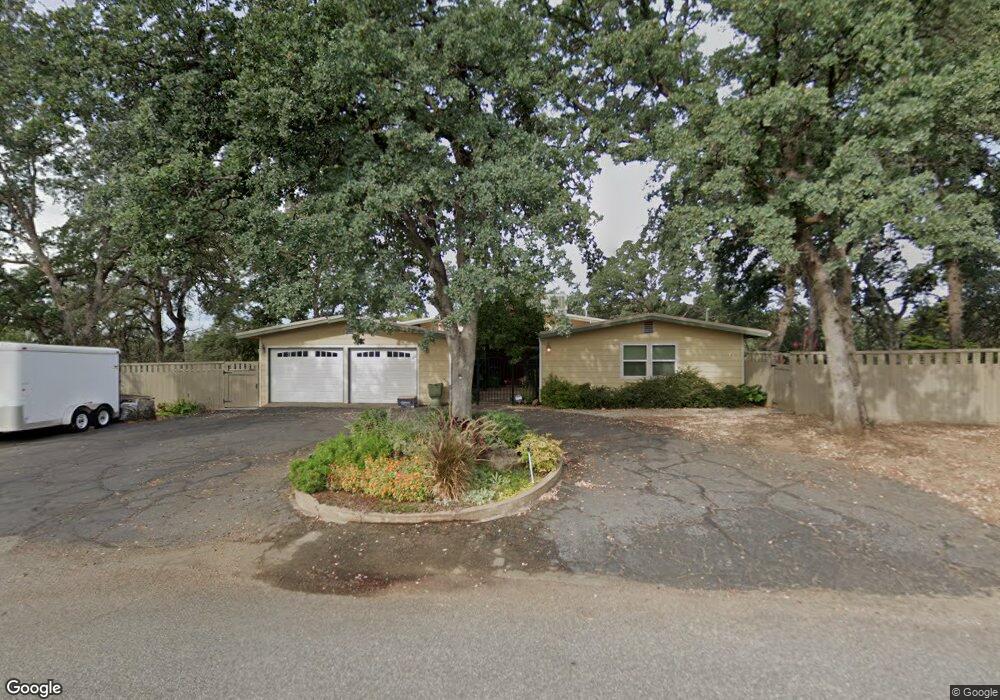
3637 Via Del Roble Red Bluff, CA 96080
Estimated Value: $333,000 - $431,000
4
Beds
2
Baths
1,878
Sq Ft
$210/Sq Ft
Est. Value
About This Home
This home is located at 3637 Via Del Roble, Red Bluff, CA 96080 and is currently estimated at $394,554, approximately $210 per square foot. 3637 Via Del Roble is a home located in Tehama County with nearby schools including William M. Metteer Elementary School, Vista Preparatory Academy, and Red Bluff High School.
Ownership History
Date
Name
Owned For
Owner Type
Purchase Details
Closed on
Oct 8, 2024
Sold by
Stannard Kenneth R and Stannard Michelle V
Bought by
Stannard Family Trust and Stannard
Current Estimated Value
Create a Home Valuation Report for This Property
The Home Valuation Report is an in-depth analysis detailing your home's value as well as a comparison with similar homes in the area
Purchase History
| Date | Buyer | Sale Price | Title Company |
|---|---|---|---|
| Stannard Family Trust | -- | None Listed On Document |
Source: Public Records
Tax History
| Year | Tax Paid | Tax Assessment Tax Assessment Total Assessment is a certain percentage of the fair market value that is determined by local assessors to be the total taxable value of land and additions on the property. | Land | Improvement |
|---|---|---|---|---|
| 2025 | $1,498 | $153,387 | $27,579 | $125,808 |
| 2023 | $1,418 | $140,982 | $26,509 | $114,473 |
| 2022 | $1,406 | $138,262 | $25,990 | $112,272 |
| 2021 | $1,350 | $135,705 | $25,481 | $110,224 |
| 2020 | $1,374 | $134,128 | $25,220 | $108,908 |
| 2019 | $1,380 | $131,440 | $24,726 | $106,714 |
| 2018 | $1,276 | $128,903 | $24,242 | $104,661 |
| 2017 | $1,286 | $126,416 | $23,767 | $102,649 |
| 2016 | $1,200 | $123,977 | $23,301 | $100,676 |
| 2015 | $1,181 | $122,145 | $22,951 | $99,194 |
| 2014 | $1,162 | $119,793 | $22,502 | $97,291 |
Source: Public Records
Map
Nearby Homes
- 4375 Via Ventura
- 21350 Wilcox Rd
- 00 Wilcox Rd
- 14395 Del Oro Ct
- 14435 Del Oro Ct
- 21300 Meadowgate Dr
- 13925 Noble Way
- 225 Sparrow Ct
- 0 State St
- 245 Walton Ave
- 13555 California 36
- 14430 Molluc Dr
- 147 Treasure Dr
- Lot D Aloe Place
- 20662 Saddlebrook Dr
- 0 Ludlow Ave Unit SN25045951
- 0 Derby Unit 24724349
- 14465 Ryan Ln
- 23 Casa Grande Dr
- 135 Casa Grande Dr
- 4220 Via Del Roble
- 4270 Via Hermosa
- 4345 Via Hermosa
- 4175 Via Del Roble
- 4300 Via Hermosa
- 4250 Via Hermosa
- 4150 Via Del Roble
- 3630 Via Hermosa
- 4220 Via Hermosa
- 4365 Via Hermosa
- 4090 Via Del Roble
- 4370 Via Ventura
- 4355 Via Ventura
- 4350 Via Ventura
- 4315 Via Ventura
- 4315 Ventura
- 4245 Via Ventura
- 4205 Via Ventura
- 4420 Via Hermosa
- 4105 Via Ventura
Your Personal Tour Guide
Ask me questions while you tour the home.