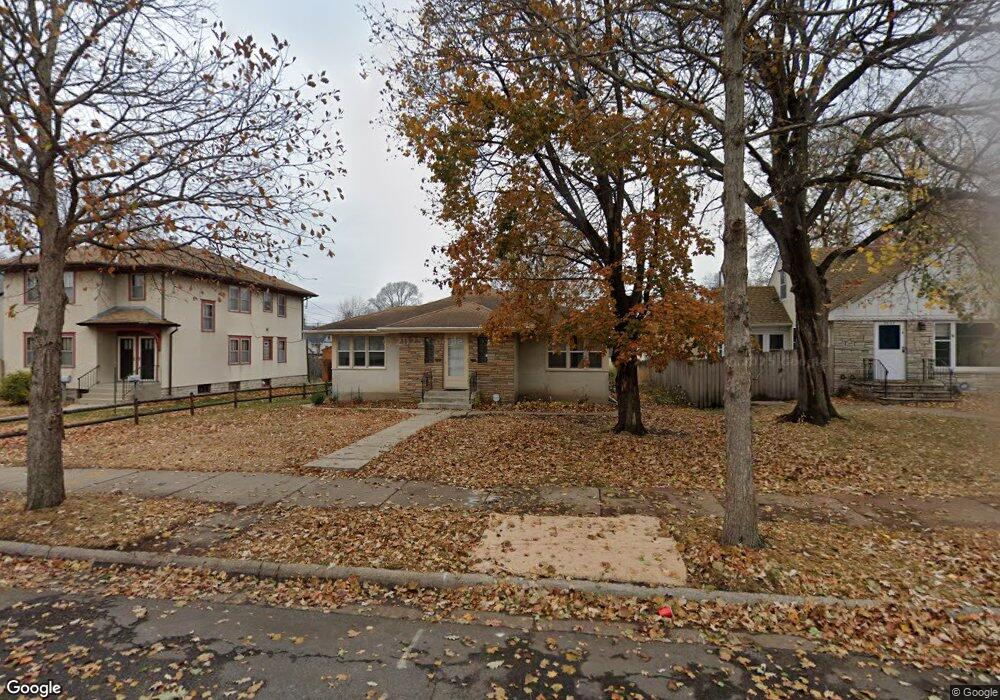
3638 19th Ave S Minneapolis, MN 55407
Standish NeighborhoodEstimated Value: $420,000 - $459,824
5
Beds
2
Baths
1,936
Sq Ft
$226/Sq Ft
Est. Value
About This Home
This home is located at 3638 19th Ave S, Minneapolis, MN 55407 and is currently estimated at $438,456, approximately $226 per square foot. 3638 19th Ave S is a home located in Hennepin County with nearby schools including Andersen United Middle School, Andersen Middle, and South Senior High School.
Ownership History
Date
Name
Owned For
Owner Type
Purchase Details
Closed on
Feb 21, 2020
Sold by
Dozier Ukee D and Dozier Angela R
Bought by
Towns Tiana M
Current Estimated Value
Home Financials for this Owner
Home Financials are based on the most recent Mortgage that was taken out on this home.
Original Mortgage
$335,805
Outstanding Balance
$296,763
Interest Rate
3.5%
Mortgage Type
FHA
Estimated Equity
$141,693
Purchase Details
Closed on
Jul 27, 2016
Sold by
Hall Alvin J and Hall Joanne M
Bought by
Dozler Ukee D
Purchase Details
Closed on
Jul 5, 2016
Sold by
Robinson Wayne A and Robinson Cassandra E
Bought by
Hall Alvin J
Purchase Details
Closed on
Nov 19, 2012
Sold by
Bloomington Holdings Llc
Bought by
Thistle Mark and Thistle Kristen
Purchase Details
Closed on
Sep 21, 2006
Sold by
Wilkinson Robert S
Bought by
Robinson Wayne A and Hael Alvin J
Purchase Details
Closed on
Nov 20, 1998
Sold by
Wilkens Larry L
Bought by
Wilkinson Robert S
Create a Home Valuation Report for This Property
The Home Valuation Report is an in-depth analysis detailing your home's value as well as a comparison with similar homes in the area
Home Values in the Area
Average Home Value in this Area
Purchase History
| Date | Buyer | Sale Price | Title Company |
|---|---|---|---|
| Towns Tiana M | $342,000 | Results Title | |
| Dozler Ukee D | $267,775 | Esquire Title Services Llc | |
| Hall Alvin J | -- | None Available | |
| Thistle Mark | -- | None Available | |
| Robinson Wayne A | $239,000 | -- | |
| Wilkinson Robert S | $132,000 | -- |
Source: Public Records
Mortgage History
| Date | Status | Borrower | Loan Amount |
|---|---|---|---|
| Open | Towns Tiana M | $335,805 |
Source: Public Records
Tax History Compared to Growth
Tax History
| Year | Tax Paid | Tax Assessment Tax Assessment Total Assessment is a certain percentage of the fair market value that is determined by local assessors to be the total taxable value of land and additions on the property. | Land | Improvement |
|---|---|---|---|---|
| 2024 | $7,965 | $404,000 | $142,000 | $262,000 |
| 2023 | $11,598 | $405,000 | $129,000 | $276,000 |
| 2022 | $6,127 | $372,000 | $105,000 | $267,000 |
| 2021 | $4,019 | $327,000 | $71,000 | $256,000 |
| 2020 | $4,315 | $308,500 | $52,500 | $256,000 |
| 2019 | $4,067 | $296,500 | $35,000 | $261,500 |
| 2018 | $3,489 | $282,500 | $35,000 | $247,500 |
| 2017 | $3,070 | $215,000 | $31,800 | $183,200 |
| 2016 | $4,152 | $215,000 | $31,800 | $183,200 |
| 2015 | $3,786 | $187,000 | $31,800 | $155,200 |
| 2014 | -- | $172,000 | $31,800 | $140,200 |
Source: Public Records
Map
Nearby Homes
- 3641 19th Ave S
- 3729 19th Ave S
- 1911 E 35th St
- 3501 Cedar Ave S
- 3813 Longfellow Ave
- 3444 Cedar Ave S
- 3600 17th Ave S Unit 301
- 3501 22nd Ave S
- 3847 Cedar Ave S
- 3509 16th Ave S
- 3555 Bloomington Ave
- 3447 16th Ave S
- 3852 22nd Ave S
- 3924 Longfellow Ave
- 3724 Bloomington Ave
- 3309 Cedar Ave S
- 3304 Longfellow Ave
- 3535 15th Ave S
- 3936 21st Ave S
- 3037 15th Ave S
- 3644 19th Ave S
- 3632 19th Ave S
- 3648 19th Ave S
- 3626 19th Ave S
- 3639 Longfellow Ave
- 3652 19th Ave S
- 3635 Longfellow Ave
- 3643 Longfellow Ave
- 3631 Longfellow Ave
- 3647 Longfellow Ave
- 3627 Longfellow Ave
- 3620 19th Ave S
- 3656 19th Ave S
- 3637 19th Ave S
- 3631 19th Ave S
- 3651 Longfellow Ave
- 3625 Longfellow Ave
- 3616 19th Ave S
- 3655 Longfellow Ave
- 3621 Longfellow Ave