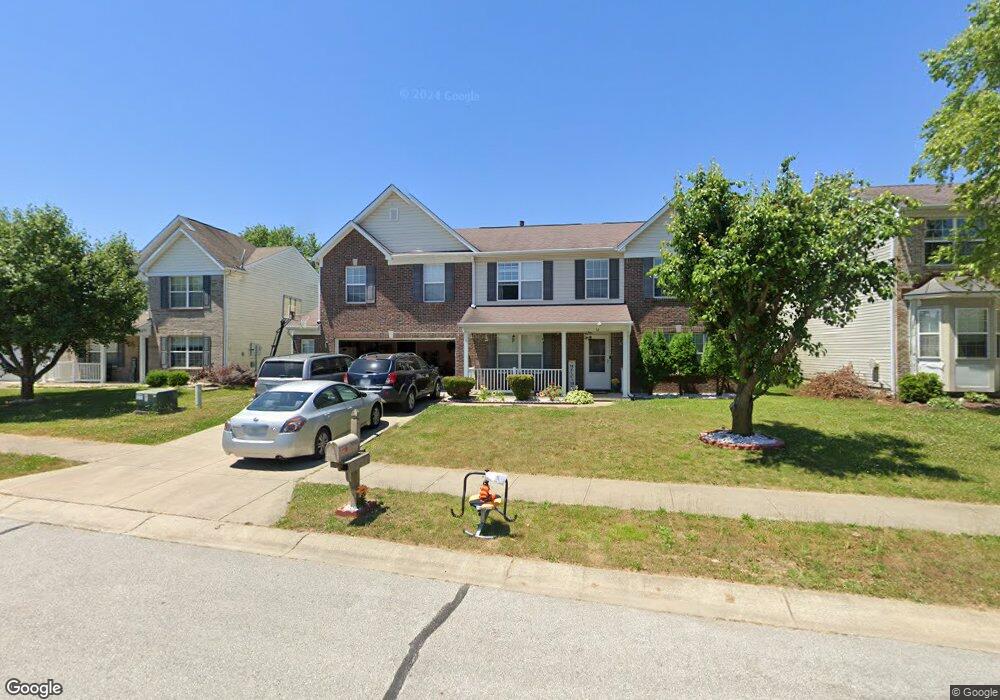
3640 Newberry Rd Plainfield, IN 46168
Estimated Value: $364,491 - $396,000
4
Beds
3
Baths
3,136
Sq Ft
$123/Sq Ft
Est. Value
About This Home
This home is located at 3640 Newberry Rd, Plainfield, IN 46168 and is currently estimated at $386,373, approximately $123 per square foot. 3640 Newberry Rd is a home located in Hendricks County with nearby schools including Cascade Senior High School and Saint Susanna School.
Ownership History
Date
Name
Owned For
Owner Type
Purchase Details
Closed on
Sep 5, 2013
Sold by
Behal Sham S and Rani Asha
Bought by
Behal Sham S and Rani Asha
Current Estimated Value
Purchase Details
Closed on
Nov 16, 2010
Sold by
Behal Sham Sunder
Bought by
Behal Sham Sunder and Rani Asha
Purchase Details
Closed on
Jun 28, 2010
Sold by
Secretary Of Housing & Urban Development
Bought by
Behal Sham Sunder
Purchase Details
Closed on
Apr 27, 2010
Sold by
Bac Home Loans Servicing Lp
Bought by
Secretary Of Housing & Urban Development
Purchase Details
Closed on
Mar 18, 2010
Sold by
Fairfield Woods At Saratoga
Bought by
Bac Home Loans Servicing Lp and Countrywide Home Loans Servicing Lp
Purchase Details
Closed on
Aug 26, 2005
Sold by
Rh Of Indiana L P
Bought by
Kloss James R and Kloss Sandra K
Home Financials for this Owner
Home Financials are based on the most recent Mortgage that was taken out on this home.
Original Mortgage
$173,006
Interest Rate
5.82%
Mortgage Type
FHA
Create a Home Valuation Report for This Property
The Home Valuation Report is an in-depth analysis detailing your home's value as well as a comparison with similar homes in the area
Home Values in the Area
Average Home Value in this Area
Purchase History
| Date | Buyer | Sale Price | Title Company |
|---|---|---|---|
| Behal Sham S | -- | -- | |
| Behal Sham Sunder | -- | None Available | |
| Behal Sham Sunder | -- | None Available | |
| Secretary Of Housing & Urban Development | -- | None Available | |
| Bac Home Loans Servicing Lp | $194,603 | None Available | |
| Kloss James R | -- | None Available |
Source: Public Records
Mortgage History
| Date | Status | Borrower | Loan Amount |
|---|---|---|---|
| Previous Owner | Kloss James R | $173,006 |
Source: Public Records
Tax History
| Year | Tax Paid | Tax Assessment Tax Assessment Total Assessment is a certain percentage of the fair market value that is determined by local assessors to be the total taxable value of land and additions on the property. | Land | Improvement |
|---|---|---|---|---|
| 2025 | $2,933 | $315,800 | $53,500 | $262,300 |
| 2024 | $2,933 | $293,300 | $39,600 | $253,700 |
| 2023 | $2,733 | $281,900 | $37,800 | $244,100 |
| 2022 | $2,718 | $271,800 | $36,000 | $235,800 |
| 2021 | $2,385 | $238,500 | $34,000 | $204,500 |
| 2020 | $2,107 | $220,700 | $34,000 | $186,700 |
| 2019 | $1,964 | $205,000 | $31,100 | $173,900 |
| 2018 | $2,025 | $202,500 | $31,100 | $171,400 |
| 2017 | $1,751 | $180,500 | $27,700 | $152,800 |
| 2016 | $1,691 | $177,800 | $27,700 | $150,100 |
| 2014 | $3,436 | $171,800 | $26,600 | $145,200 |
Source: Public Records
Map
Nearby Homes
- 3675 Pickwick Cir
- 5268 Oakbrook Dr
- 4889 Lilium Dr
- 4880 Dahlia Dr
- 4877 Dahlia Dr
- 3399 Nottinghill Blvd
- 4585 Mimosa Dr
- 4955 Dahlia Dr
- 5381 Buckingham Ln
- 3356 Nottinghill Dr W
- 4011 Spirea Dr
- 4752 Petunia Dr
- 4879 Larkspur Dr
- 5093 Silverbell Dr
- 4114 Spirea Dr
- 4160 Lotus St
- 4864 Lilac Dr
- 5137 Silverbell Dr
- 5581 E County Road 350 S
- 4647 Petunia Dr
- 3644 Newberry Rd
- 3636 Newberry Rd
- 3648 Newberry Rd
- 3632 Newberry Rd
- 3628 Newberry Rd
- 3645 Newberry Rd
- 3641 Newberry Rd
- 3649 Newberry Rd
- 3624 Newberry Rd
- 3656 Newberry Rd
- 3721 Newberry Rd
- 3646 Pickwick Cir
- 3620 Newberry Rd
- 3660 Newberry Rd
- 3674 Pickwick Cir
- 3650 Pickwick Cir
- 3670 Pickwick Cir
- 3613 Newberry Rd
- 3717 S County Road 475 E
Your Personal Tour Guide
Ask me questions while you tour the home.