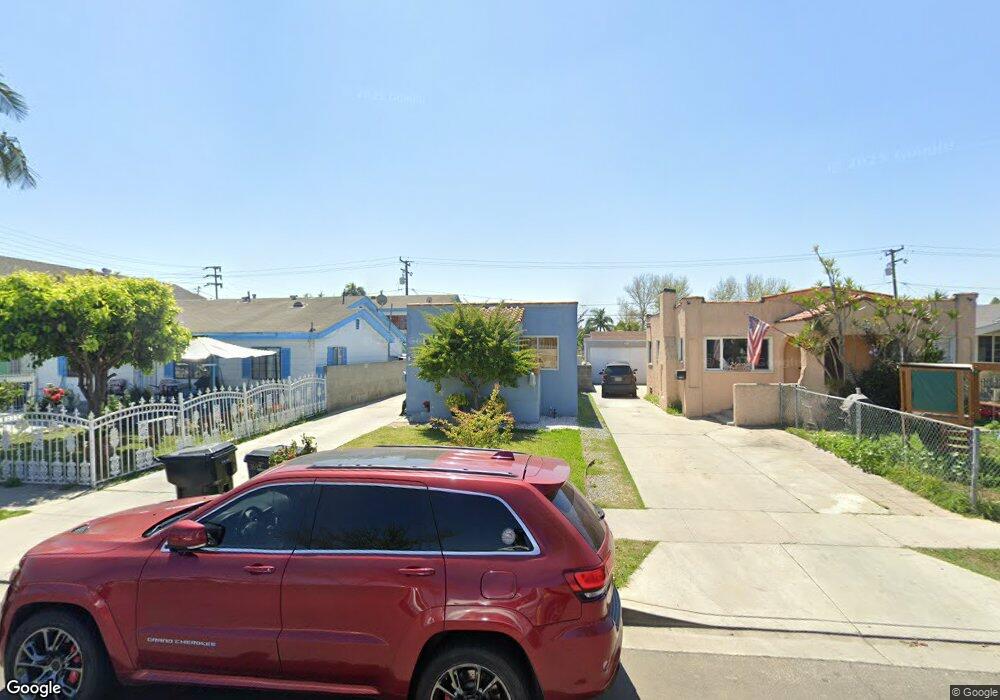
3642 E 55th St Maywood, CA 90270
Estimated Value: $623,637 - $757,000
3
Beds
3
Baths
1,633
Sq Ft
$423/Sq Ft
Est. Value
About This Home
This home is located at 3642 E 55th St, Maywood, CA 90270 and is currently estimated at $691,159, approximately $423 per square foot. 3642 E 55th St is a home located in Los Angeles County with nearby schools including Loma Vista Elementary School, Chester W. Nimitz Middle School, and Maywood Academy High School.
Ownership History
Date
Name
Owned For
Owner Type
Purchase Details
Closed on
Aug 19, 2021
Sold by
Magana Maria
Bought by
Cordova Carlos and Magana Maria
Current Estimated Value
Home Financials for this Owner
Home Financials are based on the most recent Mortgage that was taken out on this home.
Original Mortgage
$420,000
Outstanding Balance
$380,499
Interest Rate
2.8%
Mortgage Type
New Conventional
Estimated Equity
$310,660
Purchase Details
Closed on
Jun 29, 2016
Sold by
Cordova Juan Carlos
Bought by
Cordova Juan Carlos
Home Financials for this Owner
Home Financials are based on the most recent Mortgage that was taken out on this home.
Original Mortgage
$315,000
Interest Rate
3.66%
Mortgage Type
New Conventional
Purchase Details
Closed on
Jan 29, 2003
Sold by
Diaz Ovidio and Diaz Carol
Bought by
Cordova Juan Carlos
Home Financials for this Owner
Home Financials are based on the most recent Mortgage that was taken out on this home.
Original Mortgage
$210,693
Interest Rate
5.93%
Create a Home Valuation Report for This Property
The Home Valuation Report is an in-depth analysis detailing your home's value as well as a comparison with similar homes in the area
Home Values in the Area
Average Home Value in this Area
Purchase History
We collect this data history from publicly available records. To have your information removed, we recommend requesting removal directly through your county’s website.
| Date | Buyer | Sale Price | Title Company |
|---|---|---|---|
| Cordova Carlos | -- | New Title Company Name | |
| Cordova Juan Carlos | -- | Title 365 | |
| Cordova Juan Carlos | -- | Title 365 | |
| Cordova Juan Carlos | $214,000 | Fatcola |
Source: Public Records
Mortgage History
We collect this data history from publicly available records. To have your information removed, we recommend requesting removal directly through your county’s website.
| Date | Status | Borrower | Loan Amount |
|---|---|---|---|
| Open | Cordova Carlos | $420,000 | |
| Previous Owner | Cordova Juan Carlos | $315,000 | |
| Previous Owner | Cordova Juan Carlos | $210,693 |
Source: Public Records
Tax History
| Year | Tax Paid | Tax Assessment Tax Assessment Total Assessment is a certain percentage of the fair market value that is determined by local assessors to be the total taxable value of land and additions on the property. | Land | Improvement |
|---|---|---|---|---|
| 2025 | $5,066 | $309,918 | $144,820 | $165,098 |
| 2024 | $4,861 | $303,842 | $141,981 | $161,861 |
| 2023 | $4,781 | $297,886 | $139,198 | $158,688 |
| 2022 | $4,488 | $292,046 | $136,469 | $155,577 |
| 2021 | $4,428 | $286,321 | $133,794 | $152,527 |
| 2020 | $4,451 | $283,387 | $132,423 | $150,964 |
| 2019 | $4,293 | $277,831 | $129,827 | $148,004 |
| 2018 | $4,170 | $272,384 | $127,282 | $145,102 |
| 2016 | $3,917 | $261,809 | $122,341 | $139,468 |
| 2015 | $3,699 | $257,878 | $120,504 | $137,374 |
| 2014 | $3,705 | $252,828 | $118,144 | $134,684 |
Source: Public Records
Map
Nearby Homes
- 3651 E 56th St
- 3700 E 55th St
- 3725 E 57th St
- 3738 E 53rd St
- 5716 Maywood Ave
- 5117 Everett Ave
- 3519 E 60th St
- 4056 E 55th St
- 4101 E 57th St
- 5954 Riverside Ave
- 3531 E 61st St
- 4301 E 60th St
- 4361 E 56th St
- 0 0 Fir Unit 202604501
- 4439 E 52nd Place
- 6249 Hollenbeck St
- 3201 3201 Long Beach
- 6249 Newell St
- 4026 Gage Ave
- 6522 Bear Ave
- 3647 E 56th St
- 3657 E 56th St
- 5517 Loma Vista Ave
- 3643 E 56th St
- 3639 E 56th St
- 5509 Loma Vista Ave
- 3652 E 56th St
- 3654 E 56th St
- 3650 E 55th St
- 3658 E 56th St
- 3644 E 55th St
- 3633 E 56th St
- 3703 E 56th St
- 5514 Loma Vista Ave
- 3658 E 55th St
- 3638 E 55th St
- 5508 Loma Vista Ave
- 3702 E 56th St
- 3636 E 56th St
- 3623 E 56th St
Your Personal Tour Guide
Ask me questions while you tour the home.