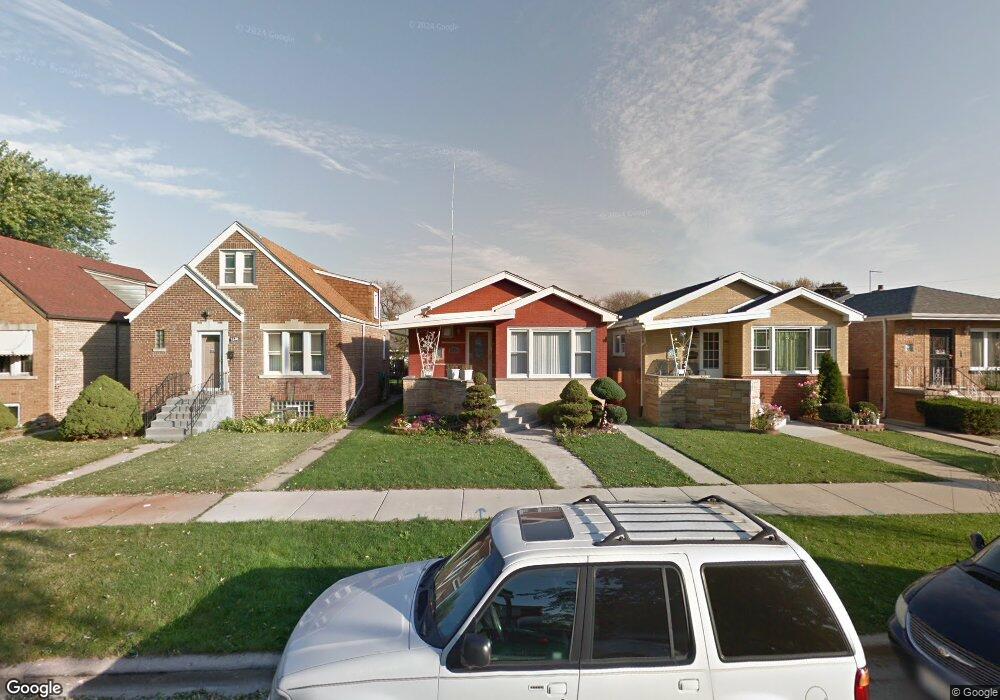
3642 W 58th Place Chicago, IL 60629
West Elsdon NeighborhoodEstimated Value: $284,000 - $315,000
4
Beds
3
Baths
1,184
Sq Ft
$254/Sq Ft
Est. Value
About This Home
This home is located at 3642 W 58th Place, Chicago, IL 60629 and is currently estimated at $300,246, approximately $253 per square foot. 3642 W 58th Place is a home located in Cook County with nearby schools including Sandoval Elementary School, Hernandez Middle School, and Solorio Acad High School.
Ownership History
Date
Name
Owned For
Owner Type
Purchase Details
Closed on
Feb 1, 2006
Sold by
Luna Laura and Luna Rodolfo
Bought by
Ortiz Vilma M
Current Estimated Value
Home Financials for this Owner
Home Financials are based on the most recent Mortgage that was taken out on this home.
Original Mortgage
$222,400
Outstanding Balance
$136,442
Interest Rate
7.76%
Mortgage Type
Unknown
Estimated Equity
$163,804
Purchase Details
Closed on
Jun 11, 2002
Sold by
Luna Laura and Sandoval Samuel J
Bought by
Luna Rodolfo and Luna Laura
Home Financials for this Owner
Home Financials are based on the most recent Mortgage that was taken out on this home.
Original Mortgage
$120,000
Interest Rate
6.79%
Purchase Details
Closed on
Nov 12, 1993
Sold by
Maday Alfred J
Bought by
Muniz Laura and Sandoval Samuel J
Home Financials for this Owner
Home Financials are based on the most recent Mortgage that was taken out on this home.
Original Mortgage
$103,772
Interest Rate
6.92%
Mortgage Type
FHA
Create a Home Valuation Report for This Property
The Home Valuation Report is an in-depth analysis detailing your home's value as well as a comparison with similar homes in the area
Home Values in the Area
Average Home Value in this Area
Purchase History
| Date | Buyer | Sale Price | Title Company |
|---|---|---|---|
| Ortiz Vilma M | $278,000 | Pntn | |
| Luna Rodolfo | -- | City Wide Title | |
| Muniz Laura | $68,666 | Attorneys Title Guaranty Fun |
Source: Public Records
Mortgage History
| Date | Status | Borrower | Loan Amount |
|---|---|---|---|
| Open | Ortiz Vilma M | $222,400 | |
| Previous Owner | Luna Rodolfo | $120,000 | |
| Previous Owner | Muniz Laura | $103,772 |
Source: Public Records
Tax History Compared to Growth
Tax History
| Year | Tax Paid | Tax Assessment Tax Assessment Total Assessment is a certain percentage of the fair market value that is determined by local assessors to be the total taxable value of land and additions on the property. | Land | Improvement |
|---|---|---|---|---|
| 2024 | $3,115 | $21,000 | $3,000 | $18,000 |
| 2023 | $3,016 | $18,000 | $3,750 | $14,250 |
| 2022 | $3,016 | $18,000 | $3,750 | $14,250 |
| 2021 | $2,950 | $18,000 | $3,750 | $14,250 |
| 2020 | $2,762 | $15,420 | $3,750 | $11,670 |
| 2019 | $2,810 | $17,326 | $3,750 | $13,576 |
| 2018 | $2,762 | $17,326 | $3,750 | $13,576 |
| 2017 | $2,502 | $14,921 | $3,375 | $11,546 |
| 2016 | $2,505 | $14,921 | $3,375 | $11,546 |
| 2015 | $2,270 | $14,921 | $3,375 | $11,546 |
| 2014 | $2,271 | $14,712 | $3,187 | $11,525 |
| 2013 | $2,215 | $14,712 | $3,187 | $11,525 |
Source: Public Records
Map
Nearby Homes
- 2711 W 59th St
- 3535 W 58th St
- 3641 W 57th St
- 3709 W 59th Place
- 3704 W 57th St
- 3745 W 59th Place
- 3502 W 58th Place
- 3710 W 60th Place
- 3441 W 59th St
- 3711 W 56th Place
- 5730 S Trumbull Ave
- 3904 W 58th Place
- 3912 W 59th St
- 3817 W 61st St
- 3909 W 60th Place
- 3927 W 56th St
- 4015 W 59th St
- 3817 W 61st Place
- 3501 W 61st Place
- 3349 W 60th Place
- 3638 W 58th Place
- 3646 W 58th Place
- 3636 W 58th Place
- 3648 W 58th Place
- 3634 W 58th Place
- 3652 W 58th Place
- 3630 W 58th Place
- 3643 W 58th St
- 3641 W 58th St
- 3628 W 58th Place
- 3637 W 58th St
- 3649 W 58th St
- 3653 W 58th St
- 3624 W 58th Place
- 3631 W 58th St
- 3645 W 58th Place
- 3641 W 58th Place
- 3649 W 58th Place