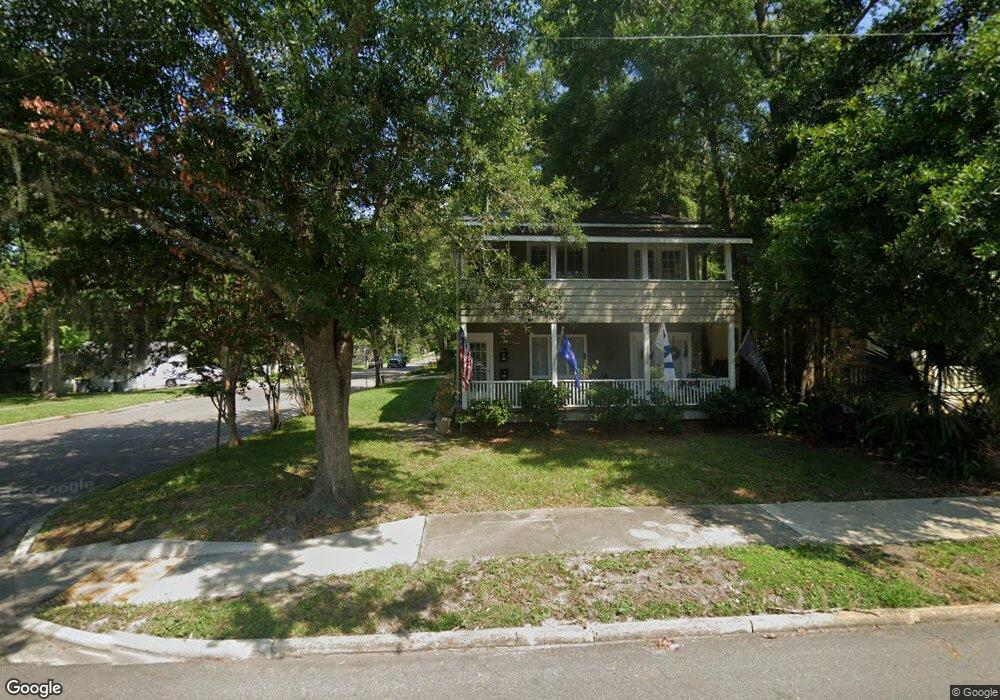
3643 Herschel St Jacksonville, FL 32205
Avondale NeighborhoodEstimated Value: $584,000 - $780,226
6
Beds
4
Baths
3,708
Sq Ft
$190/Sq Ft
Est. Value
About This Home
This home is located at 3643 Herschel St, Jacksonville, FL 32205 and is currently estimated at $703,557, approximately $189 per square foot. 3643 Herschel St is a home located in Duval County with nearby schools including West Riverside Elementary School, Andros Karperos, and Lake Shore Middle School.
Ownership History
Date
Name
Owned For
Owner Type
Purchase Details
Closed on
Nov 4, 2008
Sold by
Matyi Keith A and Matyi Lynette M
Bought by
P O S Properties Llc
Current Estimated Value
Home Financials for this Owner
Home Financials are based on the most recent Mortgage that was taken out on this home.
Original Mortgage
$247,000
Interest Rate
5.96%
Mortgage Type
Purchase Money Mortgage
Purchase Details
Closed on
Nov 1, 2000
Sold by
Szuromi Suzanne L
Bought by
Matyi Keith A and Matyi Lynette M
Home Financials for this Owner
Home Financials are based on the most recent Mortgage that was taken out on this home.
Original Mortgage
$64,490
Interest Rate
7.83%
Purchase Details
Closed on
Mar 13, 1998
Sold by
Estes V Moreau P and Estes Moreau P
Bought by
Szuromi Suzanne L
Home Financials for this Owner
Home Financials are based on the most recent Mortgage that was taken out on this home.
Original Mortgage
$60,000
Interest Rate
7.06%
Mortgage Type
Seller Take Back
Create a Home Valuation Report for This Property
The Home Valuation Report is an in-depth analysis detailing your home's value as well as a comparison with similar homes in the area
Home Values in the Area
Average Home Value in this Area
Purchase History
| Date | Buyer | Sale Price | Title Company |
|---|---|---|---|
| P O S Properties Llc | $308,800 | Homeguard Title & Trust Of O | |
| Matyi Keith A | $75,500 | First American Title Ins Co | |
| Szuromi Suzanne L | $65,000 | Universal Title Services Inc |
Source: Public Records
Mortgage History
| Date | Status | Borrower | Loan Amount |
|---|---|---|---|
| Previous Owner | P O S Properties Llc | $247,000 | |
| Previous Owner | Matyi Keith A | $64,490 | |
| Previous Owner | Szuromi Suzanne L | $60,000 |
Source: Public Records
Tax History Compared to Growth
Tax History
| Year | Tax Paid | Tax Assessment Tax Assessment Total Assessment is a certain percentage of the fair market value that is determined by local assessors to be the total taxable value of land and additions on the property. | Land | Improvement |
|---|---|---|---|---|
| 2025 | $10,884 | $597,894 | -- | -- |
| 2024 | $10,372 | $625,725 | $139,195 | $486,530 |
| 2023 | $10,372 | $625,725 | $139,195 | $486,530 |
| 2022 | $9,256 | $622,944 | $119,310 | $503,634 |
| 2021 | $8,141 | $467,208 | $119,310 | $347,898 |
| 2020 | $7,625 | $444,960 | $83,517 | $361,443 |
| 2019 | $6,825 | $407,880 | $99,425 | $308,455 |
| 2018 | $6,528 | $407,880 | $99,425 | $308,455 |
| 2017 | $6,019 | $367,092 | $55,678 | $311,414 |
| 2016 | $5,792 | $359,820 | $0 | $0 |
| 2015 | $5,510 | $341,829 | $0 | $0 |
| 2014 | $4,542 | $235,021 | $0 | $0 |
Source: Public Records
Map
Nearby Homes
- 3658 Herschel St
- 3672 Boone Park Ave
- 3675 Oak St
- 3668 Valencia Rd
- 3675 Valencia Rd
- 3638 Walsh St
- 3612 Riverside Ave
- 1608 Talbot Ave
- 3677 Walsh St
- 1709 Pine Grove Ave
- 1755 Pine Grove Ave
- 3515 Valencia Rd
- 1441 Rensselaer Ave
- 3665 Hedrick St
- 3854 Valencia Rd
- 1444 Talbot Ave
- 3849 Valencia Rd
- 3685 Hedrick St
- 3865 Saint Johns Ave
- 3852 Saint Johns Ave
- 3643 Herschel St Unit 2
- 3643 Herschel St Unit 1
- 3639 Herschel St
- 3635 Herschel St
- 3649 Herschel St Unit 2
- 3649 Herschel St
- 3640 Boone Park Ave
- 1653 Dancy St
- 1653 Dancy St Unit 2
- 1653 Dancy St Unit 1
- 1653 Dancy St
- 3655 Herschel St
- 3634 Boone Park Ave
- 3634 Boone Park Ave Unit A
- 3634 Boone Park Ave Unit 2
- 3634 Boone Park Ave Unit 1
- 3648 Boone Park Ave
- 1710 Dancy St
- 3640 Herschel St
- 3629 Herschel St