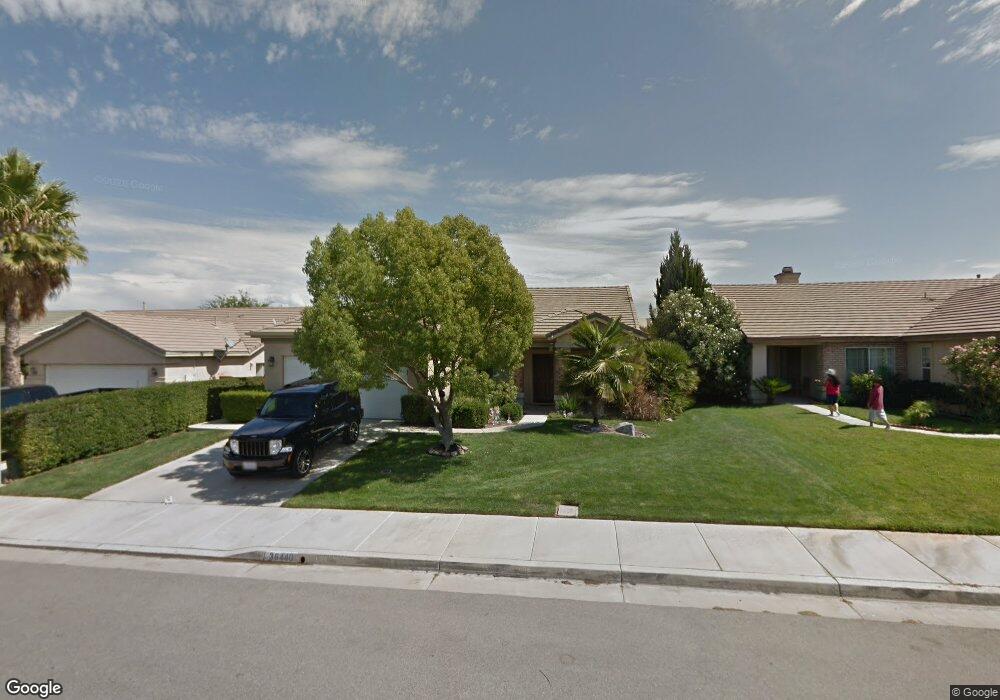
36440 Rotterdam St Winchester, CA 92596
Estimated Value: $608,000 - $634,000
3
Beds
2
Baths
1,874
Sq Ft
$331/Sq Ft
Est. Value
About This Home
This home is located at 36440 Rotterdam St, Winchester, CA 92596 and is currently estimated at $620,228, approximately $330 per square foot. 36440 Rotterdam St is a home located in Riverside County with nearby schools including French Valley Elementary School, Bella Vista Middle School, and Chaparral High School.
Ownership History
Date
Name
Owned For
Owner Type
Purchase Details
Closed on
Sep 23, 2020
Sold by
Richards Scott W and Richards Theresa J
Bought by
Richards Scott W and Richards Theresa J
Current Estimated Value
Purchase Details
Closed on
Jun 21, 2005
Sold by
Bland Mark and Bland Hiroko
Bought by
Richards Scott W and Richards Theresa J
Home Financials for this Owner
Home Financials are based on the most recent Mortgage that was taken out on this home.
Original Mortgage
$290,000
Outstanding Balance
$148,954
Interest Rate
5.51%
Mortgage Type
New Conventional
Estimated Equity
$471,274
Purchase Details
Closed on
Apr 16, 1999
Sold by
The Forecast Group Lp
Bought by
Bland Mark and Bland Hiroko
Home Financials for this Owner
Home Financials are based on the most recent Mortgage that was taken out on this home.
Original Mortgage
$155,410
Interest Rate
6.98%
Mortgage Type
VA
Create a Home Valuation Report for This Property
The Home Valuation Report is an in-depth analysis detailing your home's value as well as a comparison with similar homes in the area
Home Values in the Area
Average Home Value in this Area
Purchase History
| Date | Buyer | Sale Price | Title Company |
|---|---|---|---|
| Richards Scott W | -- | None Available | |
| Richards Scott W | $405,000 | First American Title | |
| Bland Mark | $155,500 | Orange Coast Title |
Source: Public Records
Mortgage History
| Date | Status | Borrower | Loan Amount |
|---|---|---|---|
| Open | Richards Scott W | $290,000 | |
| Previous Owner | Bland Mark | $155,410 |
Source: Public Records
Tax History Compared to Growth
Tax History
| Year | Tax Paid | Tax Assessment Tax Assessment Total Assessment is a certain percentage of the fair market value that is determined by local assessors to be the total taxable value of land and additions on the property. | Land | Improvement |
|---|---|---|---|---|
| 2025 | $5,701 | $553,446 | $204,978 | $348,468 |
| 2023 | $5,701 | $531,957 | $197,019 | $334,938 |
| 2022 | $5,544 | $521,527 | $193,156 | $328,371 |
| 2021 | $4,823 | $452,303 | $167,964 | $284,339 |
| 2020 | $4,311 | $403,842 | $149,968 | $253,874 |
| 2019 | $4,217 | $392,080 | $145,600 | $246,480 |
| 2018 | $4,064 | $377,000 | $140,000 | $237,000 |
| 2017 | $3,757 | $347,000 | $129,000 | $218,000 |
| 2016 | $3,596 | $332,000 | $123,000 | $209,000 |
| 2015 | $3,407 | $315,000 | $117,000 | $198,000 |
| 2014 | $3,309 | $309,000 | $114,000 | $195,000 |
Source: Public Records
Map
Nearby Homes
- 36423 Rotterdam St
- 31572 Adour Way
- 31556 Umbria Ln
- 31431 Bradford St
- 36045 Glasgow St
- 31659 Poppy St
- 31759 Delfina Way
- 31771 Biagio Way
- 31369 Frans Hals Dr
- 36315 Antoinette Ln
- 30951 Benton Rd
- 36358 Matino Ln
- 36918 Blanc Ct
- 31796 Gimbal Way
- 36316 Cosimo Ln
- 36355 Amerigo Ln
- 36316 Grazia Way Unit 167
- 36320 Grazia Way
- 31809 Delfina Way
- 35887 Rhone Ln
- 36430 Rotterdam St
- 36450 Rotterdam St
- 36437 Seine Ct
- 36447 Seine Ct
- 36420 Rotterdam St
- 31356 Rivera St
- 31366 Rivera St
- 36427 Seine Ct
- 36443 Rotterdam St
- 31376 Rivera St
- 36410 Rotterdam St
- 36433 Rotterdam St
- 36463 Rotterdam St
- 36457 Seine Ct
- 31386 Rivera St
- 36417 Seine Ct Unit 2279233-4663
- 36417 Seine Ct
- 36400 Rotterdam St
- 36413 Rotterdam St
- 36473 Rotterdam St