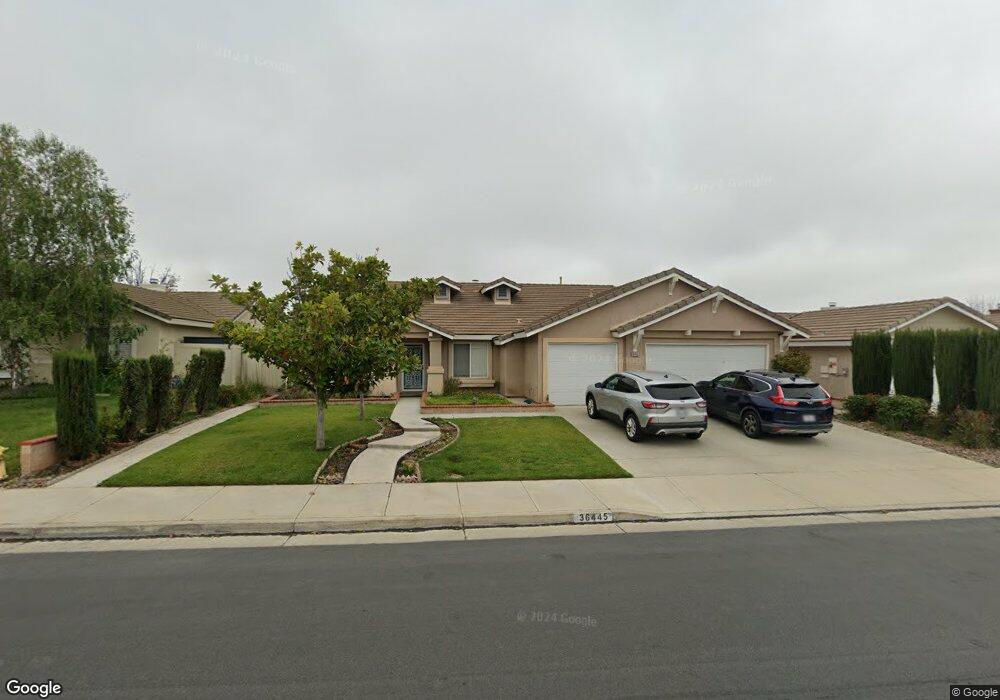
36445 Cognac St Winchester, CA 92596
Estimated Value: $616,000 - $636,000
4
Beds
3
Baths
2,090
Sq Ft
$301/Sq Ft
Est. Value
About This Home
This home is located at 36445 Cognac St, Winchester, CA 92596 and is currently estimated at $629,310, approximately $301 per square foot. 36445 Cognac St is a home located in Riverside County with nearby schools including French Valley Elementary School, Bella Vista Middle School, and Chaparral High School.
Ownership History
Date
Name
Owned For
Owner Type
Purchase Details
Closed on
Aug 20, 2012
Sold by
Mulhern David
Bought by
Mulhern Kenneth and Mulhern Barbara J
Current Estimated Value
Purchase Details
Closed on
Oct 23, 2010
Sold by
Brown Thomas W and Brown Maria R
Bought by
Mulhern Kenmoth R and Mulhern Barbara J
Home Financials for this Owner
Home Financials are based on the most recent Mortgage that was taken out on this home.
Original Mortgage
$60,000
Interest Rate
4.33%
Mortgage Type
New Conventional
Purchase Details
Closed on
May 16, 2000
Sold by
Barratt American Inc
Bought by
Brown Thomas W and Brown Maria R
Home Financials for this Owner
Home Financials are based on the most recent Mortgage that was taken out on this home.
Original Mortgage
$199,988
Interest Rate
8.18%
Mortgage Type
VA
Create a Home Valuation Report for This Property
The Home Valuation Report is an in-depth analysis detailing your home's value as well as a comparison with similar homes in the area
Home Values in the Area
Average Home Value in this Area
Purchase History
| Date | Buyer | Sale Price | Title Company |
|---|---|---|---|
| Mulhern Kenneth | -- | None Available | |
| Mulhern Kenmoth R | $207,000 | Fidelity National Title | |
| Brown Thomas W | $200,000 | Fidelity National Title Co |
Source: Public Records
Mortgage History
| Date | Status | Borrower | Loan Amount |
|---|---|---|---|
| Previous Owner | Mulhern Kenmoth R | $60,000 | |
| Previous Owner | Brown Thomas W | $199,988 |
Source: Public Records
Tax History Compared to Growth
Tax History
| Year | Tax Paid | Tax Assessment Tax Assessment Total Assessment is a certain percentage of the fair market value that is determined by local assessors to be the total taxable value of land and additions on the property. | Land | Improvement |
|---|---|---|---|---|
| 2025 | $3,150 | $265,186 | $76,863 | $188,323 |
| 2023 | $3,150 | $254,890 | $73,879 | $181,011 |
| 2022 | $3,038 | $249,893 | $72,431 | $177,462 |
| 2021 | $2,960 | $244,994 | $71,011 | $173,983 |
| 2020 | $2,897 | $242,483 | $70,283 | $172,200 |
| 2019 | $2,853 | $237,729 | $68,905 | $168,824 |
| 2018 | $2,807 | $233,068 | $67,555 | $165,513 |
| 2017 | $2,764 | $228,499 | $66,231 | $162,268 |
| 2016 | $2,714 | $224,020 | $64,933 | $159,087 |
| 2015 | $2,671 | $220,657 | $63,958 | $156,699 |
| 2014 | $2,602 | $216,337 | $62,706 | $153,631 |
Source: Public Records
Map
Nearby Homes
- 36423 Rotterdam St
- 36045 Glasgow St
- 31572 Adour Way
- 31556 Umbria Ln
- 31431 Bradford St
- 31659 Poppy St
- 30951 Benton Rd
- 31369 Frans Hals Dr
- 36918 Blanc Ct
- 31759 Delfina Way
- 31771 Biagio Way
- 36315 Antoinette Ln
- 36358 Matino Ln
- 31796 Gimbal Way
- 31309 Van Ruysdael Ln
- 35887 Rhone Ln
- 36355 Amerigo Ln
- 36316 Grazia Way Unit 167
- 36320 Grazia Way
- 31809 Delfina Way
- 36435 Cognac St
- 36455 Cognac St
- 36444 Erika Ct
- 36454 Erika Ct
- 36434 Erika Ct
- 36434 Erika Ct
- 36425 Cognac St
- 36465 Cognac St
- 36458 Cognac St
- 36438 Cognac St
- 36424 Erika Ct
- 36464 Erika Ct
- 36428 Cognac St
- 36468 Cognac St
- 36415 Cognac St
- 36474 Erika Ct
- 36414 Erika Ct
- 36441 Erika Ct
- 36478 Cognac St
- 36418 Cognac St