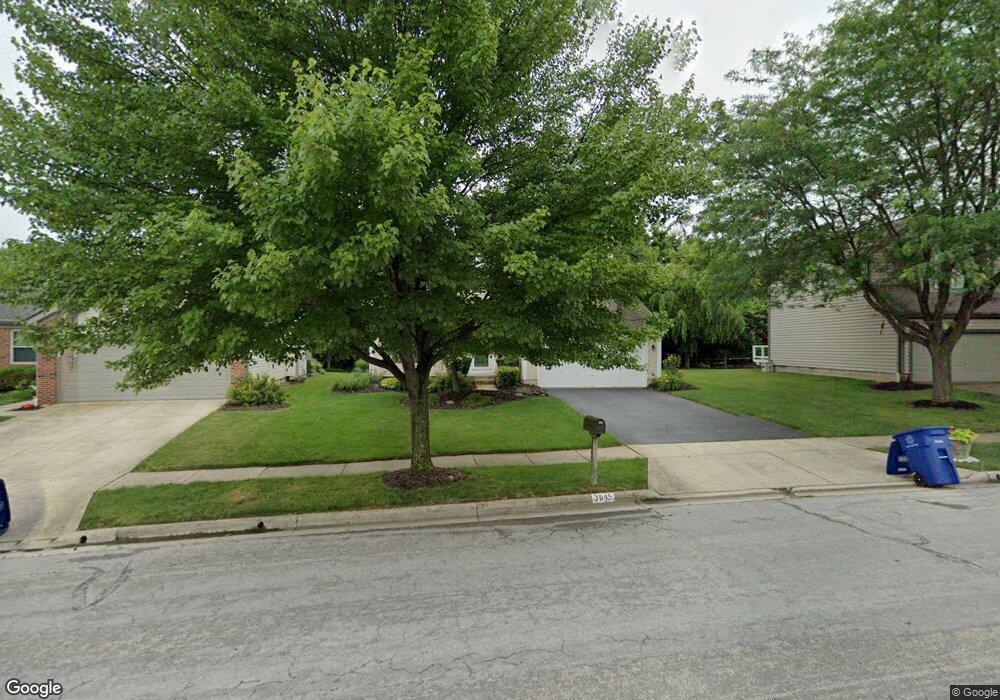
3645 Newell Dr Columbus, OH 43228
Scioto Woods NeighborhoodEstimated Value: $413,436 - $454,000
4
Beds
3
Baths
2,018
Sq Ft
$215/Sq Ft
Est. Value
About This Home
This home is located at 3645 Newell Dr, Columbus, OH 43228 and is currently estimated at $434,359, approximately $215 per square foot. 3645 Newell Dr is a home located in Franklin County with nearby schools including Beacon Elementary School, Hilliard Tharp Sixth Grade Elementary School, and Hilliard Weaver Middle School.
Ownership History
Date
Name
Owned For
Owner Type
Purchase Details
Closed on
Oct 23, 2024
Sold by
Taylor Patricia Ann
Bought by
Taylor Patricia Ann and Taylor Raymond Winn
Current Estimated Value
Purchase Details
Closed on
Nov 9, 2022
Sold by
Taylor Patricia A
Bought by
Taylor Patricia A and Taylor Raymond W
Purchase Details
Closed on
Jul 12, 2007
Sold by
Taylor Larry A
Bought by
Taylor Patricia A
Home Financials for this Owner
Home Financials are based on the most recent Mortgage that was taken out on this home.
Original Mortgage
$147,000
Interest Rate
6.49%
Mortgage Type
Purchase Money Mortgage
Purchase Details
Closed on
Dec 2, 1993
Bought by
Taylor Larry A
Purchase Details
Closed on
Oct 26, 1993
Create a Home Valuation Report for This Property
The Home Valuation Report is an in-depth analysis detailing your home's value as well as a comparison with similar homes in the area
Home Values in the Area
Average Home Value in this Area
Purchase History
| Date | Buyer | Sale Price | Title Company |
|---|---|---|---|
| Taylor Patricia Ann | -- | None Listed On Document | |
| Taylor Patricia A | -- | -- | |
| Taylor Patricia A | -- | None Available | |
| Taylor Larry A | $131,900 | -- | |
| -- | -- | -- |
Source: Public Records
Mortgage History
| Date | Status | Borrower | Loan Amount |
|---|---|---|---|
| Previous Owner | Taylor Patricia A | $147,000 |
Source: Public Records
Tax History Compared to Growth
Tax History
| Year | Tax Paid | Tax Assessment Tax Assessment Total Assessment is a certain percentage of the fair market value that is determined by local assessors to be the total taxable value of land and additions on the property. | Land | Improvement |
|---|---|---|---|---|
| 2024 | $6,692 | $118,480 | $39,380 | $79,100 |
| 2023 | $5,797 | $118,475 | $39,375 | $79,100 |
| 2022 | $5,268 | $86,210 | $14,320 | $71,890 |
| 2021 | $5,263 | $86,210 | $14,320 | $71,890 |
| 2020 | $5,248 | $86,210 | $14,320 | $71,890 |
| 2019 | $4,946 | $69,380 | $11,450 | $57,930 |
| 2018 | $4,870 | $69,380 | $11,450 | $57,930 |
| 2017 | $4,925 | $69,380 | $11,450 | $57,930 |
| 2016 | $5,138 | $67,030 | $11,590 | $55,440 |
| 2015 | $4,815 | $67,030 | $11,590 | $55,440 |
| 2014 | $4,824 | $67,030 | $11,590 | $55,440 |
| 2013 | $2,348 | $64,400 | $11,585 | $52,815 |
Source: Public Records
Map
Nearby Homes
- 3664 Grimes Dr
- 3495 La Coste Ln
- 3757 Gibbstone Dr
- 3761 Gibbstone Dr
- 3570 Dover Rd
- 3254 Dover Rd
- 3252 Dover Rd
- 4000 Sandy Ridge Dr
- 3161 Bowdoin Cir
- 1150 Romona Place
- 2051 Tuckaway Ct
- 0 Lowell Dr Unit 223009270
- 3307 Rudon Ln
- 2875 Lowell Dr
- 664 N Wilson Rd
- 2754 Scioto Station Dr
- 2704 Scioto Station Dr Unit 2704
- 2350 Hetter St
- 2867 Kobuk Dr Unit 404
- 2867 Kobuk Dr Unit 304
- 3639 Newell Dr
- 3651 Newell Dr
- 3633 Newell Dr
- 3627 Newell Dr
- 3628 Newell Dr
- 3634 Newell Dr
- 3621 Newell Dr
- 3657 Newell Dr
- 1474 Newell Ct
- 1500 Weiskopf Dr
- 3615 Newell Dr
- 3615 Newell Dr Unit OR
- 3614 Newell Dr
- 3663 Newell Dr
- 1468 Newell Ct
- 1467 Newell Ct
- 1508 Weiskopf Dr
- 3609 Newell Dr
- 3608 Newell Dr
- 3669 Newell Dr