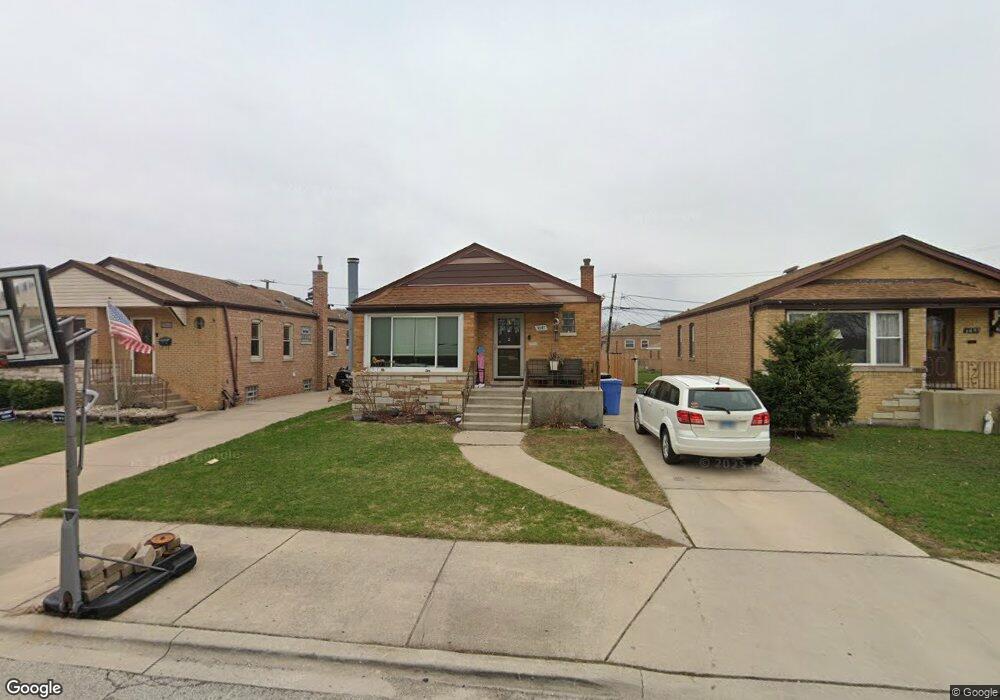
3647 W 112th Place Chicago, IL 60655
Mount Greenwood NeighborhoodEstimated Value: $322,000 - $346,000
3
Beds
2
Baths
1,167
Sq Ft
$287/Sq Ft
Est. Value
About This Home
This home is located at 3647 W 112th Place, Chicago, IL 60655 and is currently estimated at $334,539, approximately $286 per square foot. 3647 W 112th Place is a home located in Cook County with nearby schools including George F Cassell Elementary School, Morgan Park High School, and St. Christina School.
Ownership History
Date
Name
Owned For
Owner Type
Purchase Details
Closed on
Jun 1, 2009
Sold by
Sopcak Lucas D
Bought by
Sopcak Lucas and Sopcak Brittney
Current Estimated Value
Home Financials for this Owner
Home Financials are based on the most recent Mortgage that was taken out on this home.
Original Mortgage
$238,500
Outstanding Balance
$151,175
Interest Rate
4.83%
Mortgage Type
New Conventional
Estimated Equity
$183,364
Purchase Details
Closed on
Aug 25, 2006
Sold by
Sopcak Daniel
Bought by
Sopcak Lucas D
Home Financials for this Owner
Home Financials are based on the most recent Mortgage that was taken out on this home.
Original Mortgage
$220,000
Interest Rate
6.77%
Mortgage Type
Unknown
Purchase Details
Closed on
Jul 27, 1995
Sold by
Ringham James P and Bingham Jean M
Bought by
Sopcak Daniel and Sopcak Beverly J
Home Financials for this Owner
Home Financials are based on the most recent Mortgage that was taken out on this home.
Original Mortgage
$90,000
Interest Rate
7.56%
Create a Home Valuation Report for This Property
The Home Valuation Report is an in-depth analysis detailing your home's value as well as a comparison with similar homes in the area
Home Values in the Area
Average Home Value in this Area
Purchase History
| Date | Buyer | Sale Price | Title Company |
|---|---|---|---|
| Sopcak Lucas | -- | None Available | |
| Sopcak Lucas D | $275,000 | Atg | |
| Sopcak Daniel | $160,500 | Attorneys Title Guaranty Fun |
Source: Public Records
Mortgage History
| Date | Status | Borrower | Loan Amount |
|---|---|---|---|
| Open | Sopcak Lucas | $238,500 | |
| Closed | Sopcak Lucas D | $220,000 | |
| Previous Owner | Sopcak Daniel | $90,000 |
Source: Public Records
Tax History Compared to Growth
Tax History
| Year | Tax Paid | Tax Assessment Tax Assessment Total Assessment is a certain percentage of the fair market value that is determined by local assessors to be the total taxable value of land and additions on the property. | Land | Improvement |
|---|---|---|---|---|
| 2024 | $4,163 | $29,000 | $6,000 | $23,000 |
| 2023 | $4,039 | $23,000 | $4,800 | $18,200 |
| 2022 | $4,039 | $23,000 | $4,800 | $18,200 |
| 2021 | $3,967 | $23,000 | $4,800 | $18,200 |
| 2020 | $4,336 | $22,518 | $4,560 | $17,958 |
| 2019 | $4,240 | $24,477 | $4,560 | $19,917 |
| 2018 | $4,167 | $24,477 | $4,560 | $19,917 |
| 2017 | $5,103 | $23,654 | $4,080 | $19,574 |
| 2016 | $4,749 | $23,654 | $4,080 | $19,574 |
| 2015 | $4,345 | $23,654 | $4,080 | $19,574 |
| 2014 | $3,845 | $20,674 | $3,840 | $16,834 |
| 2013 | $3,769 | $20,674 | $3,840 | $16,834 |
Source: Public Records
Map
Nearby Homes
- 11038 S Lawndale Ave
- 3712 W 115th St
- 3838 W 111th St Unit 209
- 3836 W 110th Place
- 3723 W 115th Place
- 11325 S Homan Ave
- 3350 W 114th St
- 11160 S Christiana Ave
- 3836 W 115th Place
- 3435 W 115th St
- 3812 W 109th Place
- 10950 S Homan Ave
- 11157 S Spaulding Ave
- 3936 W 116th St
- 11024 S Spaulding Ave
- 3820 W 117th St
- 11551 S Komensky Ave
- 11537 S Kedvale Ave
- 3857 W 107th Place
- 3125 W 114th St
- 3651 W 112th Place
- 3643 W 112th Place
- 3655 W 112th Place
- 3639 W 112th Place
- 3659 W 112th Place
- 3646 W 113th St
- 3650 W 113th St
- 3642 W 113th St
- 11236 S Millard Ave
- 3654 W 113th St
- 3636 W 113th St
- 11248 S Millard Ave
- 3663 W 112th Place
- 3658 W 113th St
- 3662 W 113th St
- 3700 W 113th St
- 3707 W 112th Place
- 11237 S Millard Ave
- 3706 W 113th St
- 3711 W 112th Place