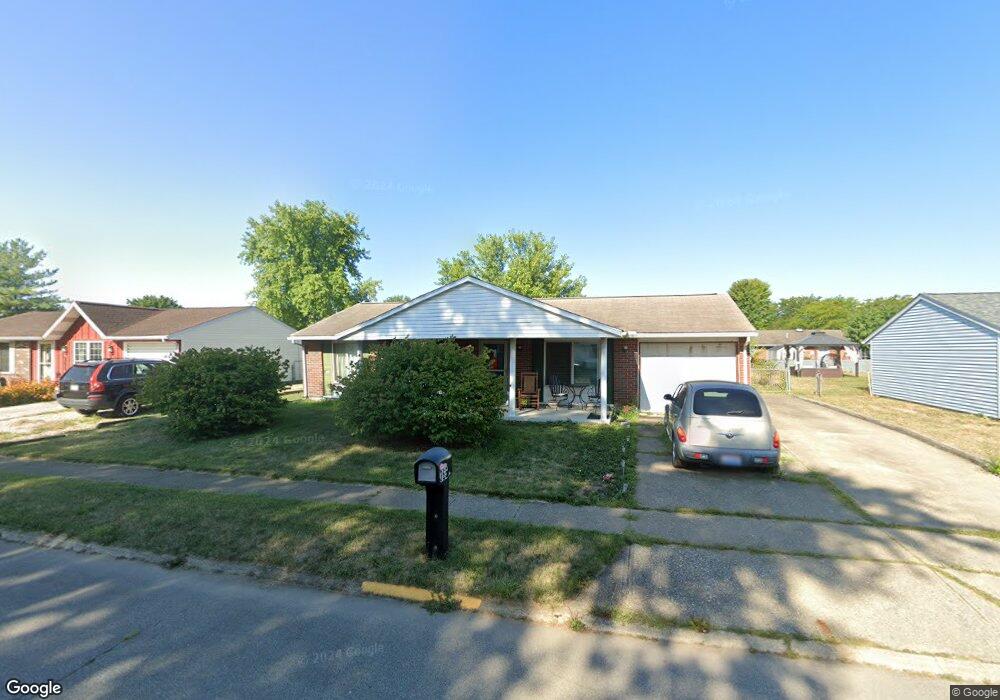
365 Apache Dr Circleville, OH 43113
Estimated Value: $237,000 - $269,000
3
Beds
1
Bath
1,350
Sq Ft
$185/Sq Ft
Est. Value
About This Home
This home is located at 365 Apache Dr, Circleville, OH 43113 and is currently estimated at $250,287, approximately $185 per square foot. 365 Apache Dr is a home located in Pickaway County with nearby schools including Logan Elm High School and Crossroads Christian Academy.
Ownership History
Date
Name
Owned For
Owner Type
Purchase Details
Closed on
Aug 18, 2004
Sold by
Stacy Charles F and Stacy Haley D
Bought by
Brown Joseph A and Brown Traci L
Current Estimated Value
Home Financials for this Owner
Home Financials are based on the most recent Mortgage that was taken out on this home.
Original Mortgage
$90,000
Outstanding Balance
$44,926
Interest Rate
6.1%
Mortgage Type
Purchase Money Mortgage
Estimated Equity
$205,361
Purchase Details
Closed on
Apr 15, 1994
Sold by
Strawser Nancy L
Bought by
Stacy Charles F
Create a Home Valuation Report for This Property
The Home Valuation Report is an in-depth analysis detailing your home's value as well as a comparison with similar homes in the area
Home Values in the Area
Average Home Value in this Area
Purchase History
| Date | Buyer | Sale Price | Title Company |
|---|---|---|---|
| Brown Joseph A | $100,000 | Chicago Title | |
| Stacy Charles F | $66,000 | -- |
Source: Public Records
Mortgage History
| Date | Status | Borrower | Loan Amount |
|---|---|---|---|
| Open | Brown Joseph A | $90,000 |
Source: Public Records
Tax History
| Year | Tax Paid | Tax Assessment Tax Assessment Total Assessment is a certain percentage of the fair market value that is determined by local assessors to be the total taxable value of land and additions on the property. | Land | Improvement |
|---|---|---|---|---|
| 2024 | $3,928 | $63,410 | $10,990 | $52,420 |
| 2023 | $2,171 | $63,410 | $10,990 | $52,420 |
| 2022 | $1,742 | $47,360 | $9,120 | $38,240 |
| 2021 | $1,785 | $47,360 | $9,120 | $38,240 |
| 2020 | $1,807 | $47,360 | $9,120 | $38,240 |
| 2019 | $1,393 | $40,110 | $9,120 | $30,990 |
| 2018 | $1,633 | $40,110 | $9,120 | $30,990 |
| 2017 | $1,349 | $40,110 | $9,120 | $30,990 |
| 2016 | $1,225 | $36,600 | $9,120 | $27,480 |
| 2015 | $1,230 | $36,600 | $9,120 | $27,480 |
| 2014 | $1,231 | $36,600 | $9,120 | $27,480 |
| 2013 | $1,270 | $36,820 | $9,120 | $27,700 |
Source: Public Records
Map
Nearby Homes
- 2020 Sioux Dr
- 331 Tarlton Rd
- 311 Tarlton Rd
- 25460 Us Highway 23 S
- 339 Walnut St
- 1028 S Court St
- 1002 S Court St
- 837 Clinton St
- 705 Clinton St
- 364 Barnes Ave
- 209 Huston St
- 546 E Ohio St
- 575 Renick Ave
- 420 Faye Ave
- 321 S Pickaway St
- 225 S Court St
- 531 E Franklin St
- 378 E Franklin St
- 551 E Main St
- 0 Ohio 56 Unit 226002334
Your Personal Tour Guide
Ask me questions while you tour the home.