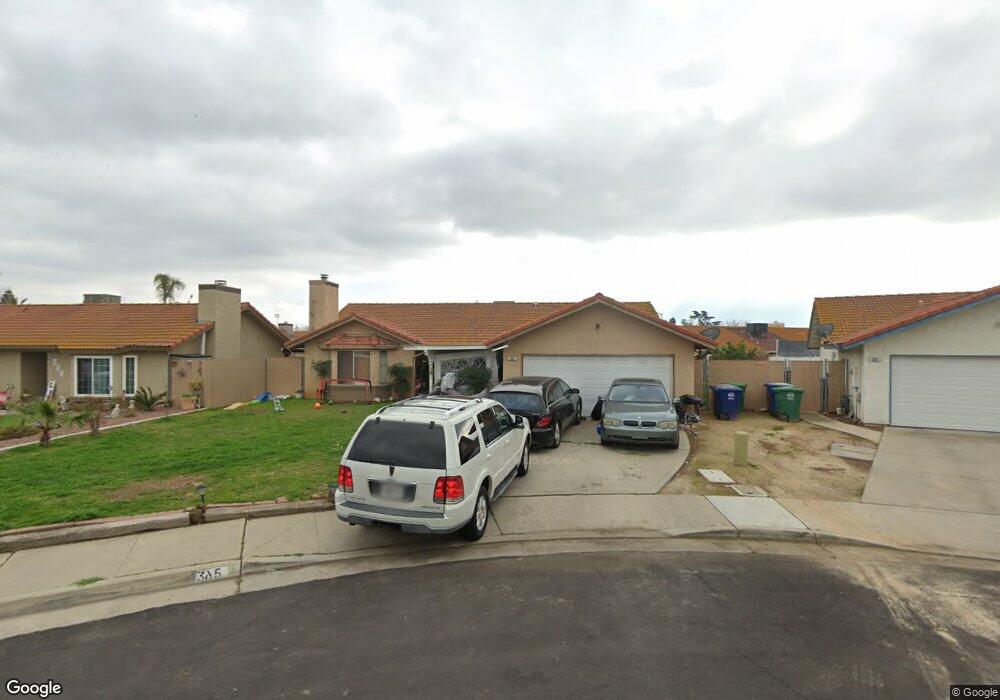
365 Faller Ct Sanger, CA 93657
Estimated Value: $366,000 - $401,000
4
Beds
2
Baths
1,554
Sq Ft
$245/Sq Ft
Est. Value
About This Home
This home is located at 365 Faller Ct, Sanger, CA 93657 and is currently estimated at $380,828, approximately $245 per square foot. 365 Faller Ct is a home located in Fresno County with nearby schools including Wilson Elementary School, Washington Academic Middle School, and Sanger High School.
Ownership History
Date
Name
Owned For
Owner Type
Purchase Details
Closed on
Dec 28, 2022
Sold by
Esquivel Family Trust
Bought by
Esquivel Mario
Current Estimated Value
Purchase Details
Closed on
Sep 1, 2000
Sold by
Deesquivel Maria
Bought by
Deesquivel Maria
Purchase Details
Closed on
Jun 15, 2000
Sold by
Michael Vallejo
Bought by
Deesquivel Maria
Home Financials for this Owner
Home Financials are based on the most recent Mortgage that was taken out on this home.
Original Mortgage
$52,500
Interest Rate
8.2%
Create a Home Valuation Report for This Property
The Home Valuation Report is an in-depth analysis detailing your home's value as well as a comparison with similar homes in the area
Home Values in the Area
Average Home Value in this Area
Purchase History
| Date | Buyer | Sale Price | Title Company |
|---|---|---|---|
| Esquivel Mario | -- | -- | |
| Deesquivel Maria | -- | -- | |
| Deesquivel Maria | $75,000 | Chicago Title Co |
Source: Public Records
Mortgage History
| Date | Status | Borrower | Loan Amount |
|---|---|---|---|
| Previous Owner | Deesquivel Maria | $52,500 |
Source: Public Records
Tax History
| Year | Tax Paid | Tax Assessment Tax Assessment Total Assessment is a certain percentage of the fair market value that is determined by local assessors to be the total taxable value of land and additions on the property. | Land | Improvement |
|---|---|---|---|---|
| 2025 | $4,676 | $369,342 | $57,222 | $312,120 |
| 2023 | $4,377 | $355,000 | $55,000 | $300,000 |
| 2022 | $1,339 | $106,473 | $42,586 | $63,887 |
| 2021 | $1,328 | $104,386 | $41,751 | $62,635 |
| 2020 | $1,290 | $103,316 | $41,323 | $61,993 |
| 2019 | $1,264 | $101,291 | $40,513 | $60,778 |
| 2018 | $1,212 | $99,306 | $39,719 | $59,587 |
| 2017 | $1,192 | $97,360 | $38,941 | $58,419 |
| 2016 | $1,121 | $95,452 | $38,178 | $57,274 |
| 2015 | $1,130 | $94,019 | $37,605 | $56,414 |
| 2014 | $1,115 | $92,178 | $36,869 | $55,309 |
Source: Public Records
Map
Nearby Homes