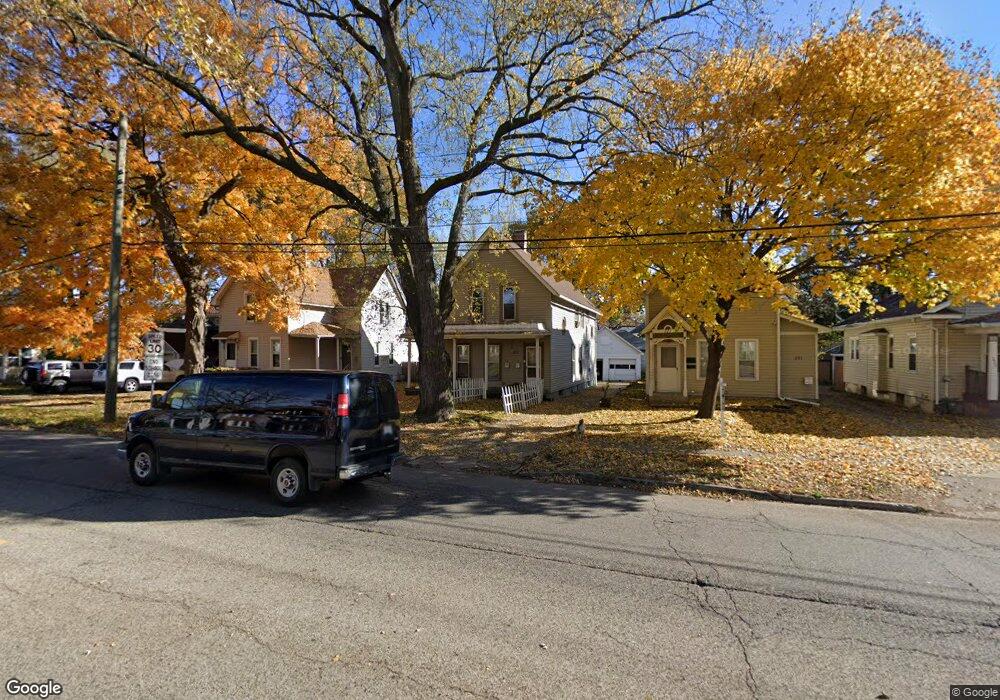
365 S State St Elgin, IL 60123
Southwest Elgin NeighborhoodEstimated Value: $278,321 - $307,000
3
Beds
2
Baths
1,960
Sq Ft
$151/Sq Ft
Est. Value
About This Home
This home is located at 365 S State St, Elgin, IL 60123 and is currently estimated at $296,080, approximately $151 per square foot. 365 S State St is a home located in Kane County with nearby schools including Lowrie Elementary School, Abbott Middle School, and Larkin High School.
Ownership History
Date
Name
Owned For
Owner Type
Purchase Details
Closed on
Apr 27, 2001
Sold by
Alvarado Jose and Alvarado Esther
Bought by
Ariza Reynaldo and Ariza Rosalinda
Current Estimated Value
Home Financials for this Owner
Home Financials are based on the most recent Mortgage that was taken out on this home.
Original Mortgage
$143,744
Outstanding Balance
$53,356
Interest Rate
6.95%
Mortgage Type
Purchase Money Mortgage
Estimated Equity
$242,724
Purchase Details
Closed on
Aug 29, 1994
Sold by
Roxworthy Dennis and Anderson Allen M
Bought by
Alvarado Jose and Alvarado Esther
Home Financials for this Owner
Home Financials are based on the most recent Mortgage that was taken out on this home.
Original Mortgage
$121,115
Interest Rate
8.44%
Mortgage Type
FHA
Purchase Details
Closed on
Aug 8, 1994
Sold by
Schaaf Ellen J and Broski Ruth
Bought by
Roxworthy Dennis and Anderson Allen M
Home Financials for this Owner
Home Financials are based on the most recent Mortgage that was taken out on this home.
Original Mortgage
$121,115
Interest Rate
8.44%
Mortgage Type
FHA
Create a Home Valuation Report for This Property
The Home Valuation Report is an in-depth analysis detailing your home's value as well as a comparison with similar homes in the area
Home Values in the Area
Average Home Value in this Area
Purchase History
We collect this data history from publicly available records. To have your information removed, we recommend requesting removal directly through your county’s website.
| Date | Buyer | Sale Price | Title Company |
|---|---|---|---|
| Ariza Reynaldo | $146,000 | Premier Title | |
| Alvarado Jose | $123,500 | Chicago Title Insurance Co | |
| Roxworthy Dennis | $85,000 | Chicago Title Insurance Co |
Source: Public Records
Mortgage History
We collect this data history from publicly available records. To have your information removed, we recommend requesting removal directly through your county’s website.
| Date | Status | Borrower | Loan Amount |
|---|---|---|---|
| Open | Ariza Reynaldo | $143,744 | |
| Previous Owner | Alvarado Jose | $121,115 |
Source: Public Records
Tax History
| Year | Tax Paid | Tax Assessment Tax Assessment Total Assessment is a certain percentage of the fair market value that is determined by local assessors to be the total taxable value of land and additions on the property. | Land | Improvement |
|---|---|---|---|---|
| 2024 | $4,496 | $72,183 | $11,400 | $60,783 |
| 2023 | $4,877 | $65,212 | $10,299 | $54,913 |
| 2022 | $4,241 | $54,910 | $9,391 | $45,519 |
| 2021 | $4,045 | $51,337 | $8,780 | $42,557 |
| 2020 | $3,923 | $49,009 | $8,382 | $40,627 |
| 2019 | $3,800 | $46,684 | $7,984 | $38,700 |
| 2018 | $3,755 | $43,979 | $7,521 | $36,458 |
| 2017 | $3,659 | $41,576 | $7,110 | $34,466 |
| 2016 | $3,474 | $38,571 | $6,596 | $31,975 |
| 2015 | -- | $35,354 | $6,046 | $29,308 |
| 2014 | -- | $34,917 | $5,971 | $28,946 |
| 2013 | -- | $35,839 | $6,129 | $29,710 |
Source: Public Records
Map
Nearby Homes
- 311 Ryerson Ave
- 447 Ashland Ave
- 410 Standish St
- 515 Oak St
- 515 Walnut Ave
- 153 Dawson Dr
- 147 River Walk Ct
- 141 S Grove Ave
- 208 Moseley St
- 168 Villa St
- 286 Villa St
- 483 Barrett St
- 433 Arlington Ave
- 315 Vandalia St
- 720 Adams St
- 555 S Liberty St
- 14 Highland Ave
- 216 Wilcox Ave
- 519 W Highland Ave
- 515 Illinois Ave
- 371 S State St
- 371 S State St Unit 1
- 371 S State St Unit 2
- 361 S State St
- 366 Ryerson Ave
- 159 Washburn St
- 163 Washburn St
- 360 Ryerson Ave
- 172 Oak St
- 370 Ryerson Ave
- 379 S State St
- 168 Oak St
- 374 Ryerson Ave
- 155 Washburn St
- 164 Oak St
- 164 Oak St Unit LOWER
- 164 Oak St Unit UPPER
- 360 S State St
- 360 S State St Unit 2
- 360 S State St Unit 1
Your Personal Tour Guide
Ask me questions while you tour the home.