Estimated Value: $1,019,000 - $1,492,000
4
Beds
3
Baths
2,180
Sq Ft
$571/Sq Ft
Est. Value
About This Home
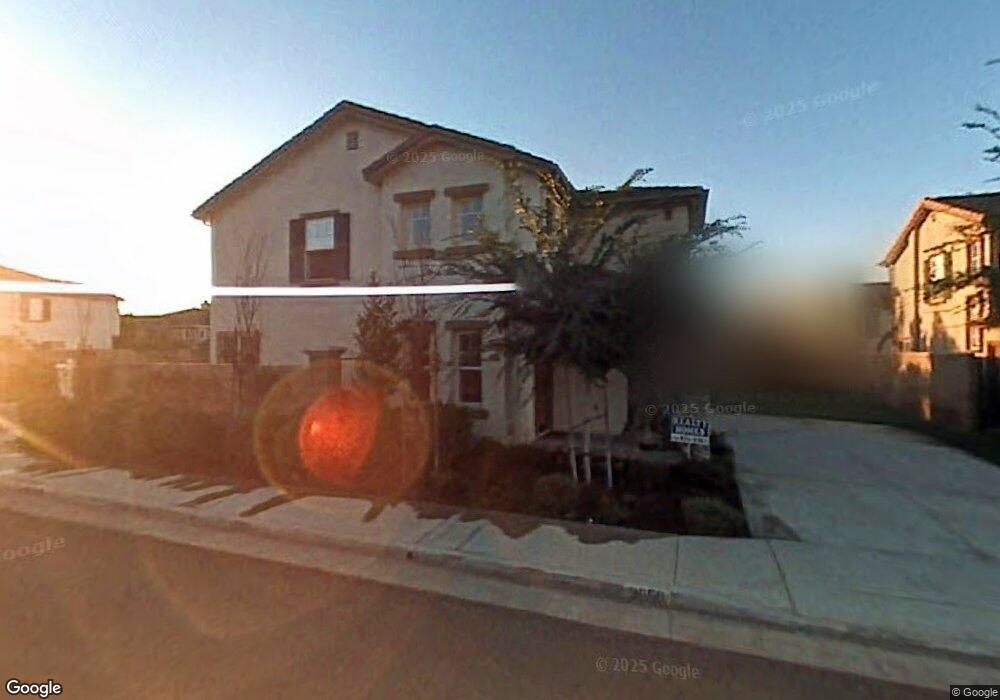
This home is located at 3650 Falcon Way, Brea, CA 92823 and is currently estimated at $1,243,767, approximately $570 per square foot. 3650 Falcon Way is a home located in Orange County with nearby schools including Olinda Elementary School, Brea Junior High School, and Brea-Olinda High School.
Ownership History
Date
Name
Owned For
Owner Type
Purchase Details
Closed on
Jun 1, 2021
Sold by
Hamabata Dudley and Hamabata Patricia A
Bought by
Hamabata Dudley and Hamabata Patricia A
Current Estimated Value
Purchase Details
Closed on
Feb 25, 2008
Sold by
Lo Joseph C
Bought by
Hamabata Dudley and Hamabata Patricia
Home Financials for this Owner
Home Financials are based on the most recent Mortgage that was taken out on this home.
Original Mortgage
$350,000
Outstanding Balance
$216,872
Interest Rate
5.64%
Mortgage Type
Purchase Money Mortgage
Estimated Equity
$1,026,895
Purchase Details
Closed on
May 6, 2002
Sold by
Kb Home Coastal Inc
Bought by
Lo Joseph C
Home Financials for this Owner
Home Financials are based on the most recent Mortgage that was taken out on this home.
Original Mortgage
$258,300
Interest Rate
6.89%
Create a Home Valuation Report for This Property
The Home Valuation Report is an in-depth analysis detailing your home's value as well as a comparison with similar homes in the area
Home Values in the Area
Average Home Value in this Area
Purchase History
| Date | Buyer | Sale Price | Title Company |
|---|---|---|---|
| Hamabata Dudley | -- | None Available | |
| Hamabata Dudley | -- | None Available | |
| Hamabata Dudley | $550,000 | Usa National Title | |
| Lo Joseph C | $369,500 | First American Title Co |
Source: Public Records
Mortgage History
| Date | Status | Borrower | Loan Amount |
|---|---|---|---|
| Open | Hamabata Dudley | $350,000 | |
| Previous Owner | Lo Joseph C | $258,300 |
Source: Public Records
Tax History Compared to Growth
Tax History
| Year | Tax Paid | Tax Assessment Tax Assessment Total Assessment is a certain percentage of the fair market value that is determined by local assessors to be the total taxable value of land and additions on the property. | Land | Improvement |
|---|---|---|---|---|
| 2025 | $8,725 | $722,428 | $404,417 | $318,011 |
| 2024 | $8,725 | $708,263 | $396,487 | $311,776 |
| 2023 | $8,519 | $694,376 | $388,713 | $305,663 |
| 2022 | $8,450 | $680,761 | $381,091 | $299,670 |
| 2021 | $8,292 | $667,413 | $373,618 | $293,795 |
| 2020 | $8,241 | $660,570 | $369,787 | $290,783 |
| 2019 | $8,032 | $647,618 | $362,536 | $285,082 |
| 2018 | $8,086 | $634,920 | $355,427 | $279,493 |
| 2017 | $7,956 | $622,471 | $348,458 | $274,013 |
| 2016 | $7,832 | $610,266 | $341,625 | $268,641 |
| 2015 | $7,606 | $590,000 | $343,631 | $246,369 |
| 2014 | $6,957 | $538,080 | $291,711 | $246,369 |
Source: Public Records
Map
Nearby Homes
- 427 Redtail Dr
- 3662 Sandpiper Way
- 2980 E Santa fe Rd
- 2965 Shamrock Ave
- 149 Bluegrass St
- 3541 Camelia Ln
- 2583 Sandpebble Ln
- 2523 Rimcrest Rd
- 2498 E Santa Paula Dr
- 418 Maravilla Ln
- 3378 Merida Ln
- 3319 Red Pine Rd
- 17265 Blue Spruce Ln
- 16774 Lake Tree Dr Unit 273
- 3400 Caraway Ln Unit 1
- 3313 Gardenia Ln
- 16901 Lake Pleasant Ln Unit 231
- 3659 Lake Grove Dr Unit 38
- 3678 Lake Crest Dr Unit 41
- 16742 Lake Ridge Way Unit 154
- 3640 Falcon Way
- 3641 Owl Place
- 3634 Falcon Way
- 3649 Falcon Way
- 3643 Falcon Way
- 3635 Owl Place
- 3664 Falcon Way
- 3637 Falcon Way
- 3628 Falcon Way
- 3629 Owl Place
- 3631 Falcon Way
- 3663 Falcon Way
- 572 Condor Ave
- 3622 Falcon Way
- 3650 Owl Place
- 3656 Owl Place
- 3672 Falcon Way
- 3644 Owl Place
- 3623 Owl Place
- 3625 Falcon Way