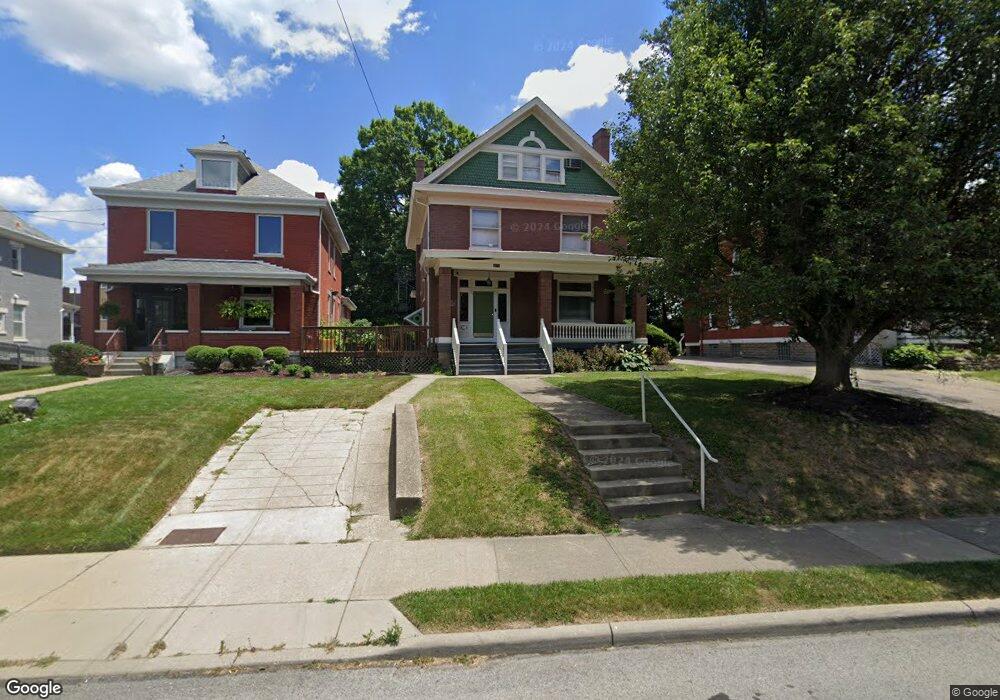
3650 Glenmore Ave Cincinnati, OH 45211
Estimated Value: $190,353
Studio
3
Baths
3,147
Sq Ft
$60/Sq Ft
Est. Value
About This Home
This home is located at 3650 Glenmore Ave, Cincinnati, OH 45211 and is currently estimated at $190,353, approximately $60 per square foot. 3650 Glenmore Ave is a home located in Hamilton County with nearby schools including Cheviot Elementary School, Western Hills High School, and Gilbert A. Dater High School.
Ownership History
Date
Name
Owned For
Owner Type
Purchase Details
Closed on
May 22, 2015
Sold by
Grants & Nestheide Enterprises
Bought by
Changing Lives Youth Services Inc
Current Estimated Value
Home Financials for this Owner
Home Financials are based on the most recent Mortgage that was taken out on this home.
Original Mortgage
$85,000
Outstanding Balance
$64,647
Interest Rate
3.65%
Mortgage Type
Future Advance Clause Open End Mortgage
Estimated Equity
$125,706
Purchase Details
Closed on
Dec 30, 1996
Sold by
Pohlman Richard A and Pohlman Laverne E
Bought by
Grant & Nestheide Enterprises
Home Financials for this Owner
Home Financials are based on the most recent Mortgage that was taken out on this home.
Original Mortgage
$97,400
Interest Rate
7.64%
Mortgage Type
Commercial
Purchase Details
Closed on
Nov 24, 1993
Sold by
Roberts Floyd A and Roberts Emma Lee
Bought by
Mueller Steven E
Create a Home Valuation Report for This Property
The Home Valuation Report is an in-depth analysis detailing your home's value as well as a comparison with similar homes in the area
Home Values in the Area
Average Home Value in this Area
Purchase History
| Date | Buyer | Sale Price | Title Company |
|---|---|---|---|
| Changing Lives Youth Services Inc | $87,700 | Attorney | |
| Grant & Nestheide Enterprises | $129,900 | -- | |
| Mueller Steven E | -- | -- |
Source: Public Records
Mortgage History
| Date | Status | Borrower | Loan Amount |
|---|---|---|---|
| Open | Changing Lives Youth Services Inc | $85,000 | |
| Previous Owner | Grant & Nestheide Enterprises | $97,400 |
Source: Public Records
Tax History
| Year | Tax Paid | Tax Assessment Tax Assessment Total Assessment is a certain percentage of the fair market value that is determined by local assessors to be the total taxable value of land and additions on the property. | Land | Improvement |
|---|---|---|---|---|
| 2025 | $4,156 | $48,661 | $24,514 | $24,147 |
| 2024 | $4,129 | $48,661 | $24,514 | $24,147 |
| 2023 | $4,117 | $48,661 | $24,514 | $24,147 |
| 2022 | $3,029 | $31,616 | $22,848 | $8,768 |
| 2021 | $3,007 | $31,616 | $22,848 | $8,768 |
| 2020 | $2,986 | $31,616 | $22,848 | $8,768 |
| 2019 | $3,158 | $30,695 | $22,183 | $8,512 |
| 2018 | $3,159 | $30,695 | $22,183 | $8,512 |
| 2017 | $3,073 | $30,695 | $22,183 | $8,512 |
| 2016 | $4,675 | $45,725 | $22,649 | $23,076 |
| 2015 | $4,317 | $45,725 | $22,649 | $23,076 |
| 2014 | $4,280 | $45,725 | $22,649 | $23,076 |
| 2013 | $4,411 | $47,139 | $23,349 | $23,790 |
Source: Public Records
Map
Nearby Homes
- 3613 Everett Ave
- 3318 Gamble Ave
- 3143 Mozart Ave
- 3744 Dina Ave
- 3831 Meyerfeld Ave
- 3713 Frances Ave
- 3709 Frances Ave
- 3232 Montana Ave
- 3273 Montana Ave
- 3927 Davis Ave
- 3226 Montana Ave
- 3869 Meyerfeld Ave
- 3449 Craig Ave
- 3935 Lovell Ave
- 3608 Robb Ave
- 3850 Taft Ave
- 3330 Sheridan St Unit 3330
- 3498 Boudinot Ave
- 3823 Applegate Ave
- 3309 Phoenix Ave
- 3646 Glenmore Ave Unit 5
- 3654 Glenmore Ave
- 3653 Mozart Ave
- 3662 Glenmore Ave
- 3642 Glenmore Ave
- 3642 Glenmore Ave Unit 2
- 3649 Mozart Ave
- 3706 Harding Ave Unit 2
- 3706 Harding Ave
- 3638 Glenmore Ave
- 3636 Saint Martins Place
- 3632 Saint Martins Place
- 3634 Glenmore Ave
- 3628 Saint Martins Place
- 3635 Glenmore Ave
- 3639 Glenmore Ave Unit 1
- 3632 Glenmore Ave
- 3639 Mozart Ave
- 3624 Saint Martins Place
- 3644 Mozart Ave
Your Personal Tour Guide
Ask me questions while you tour the home.