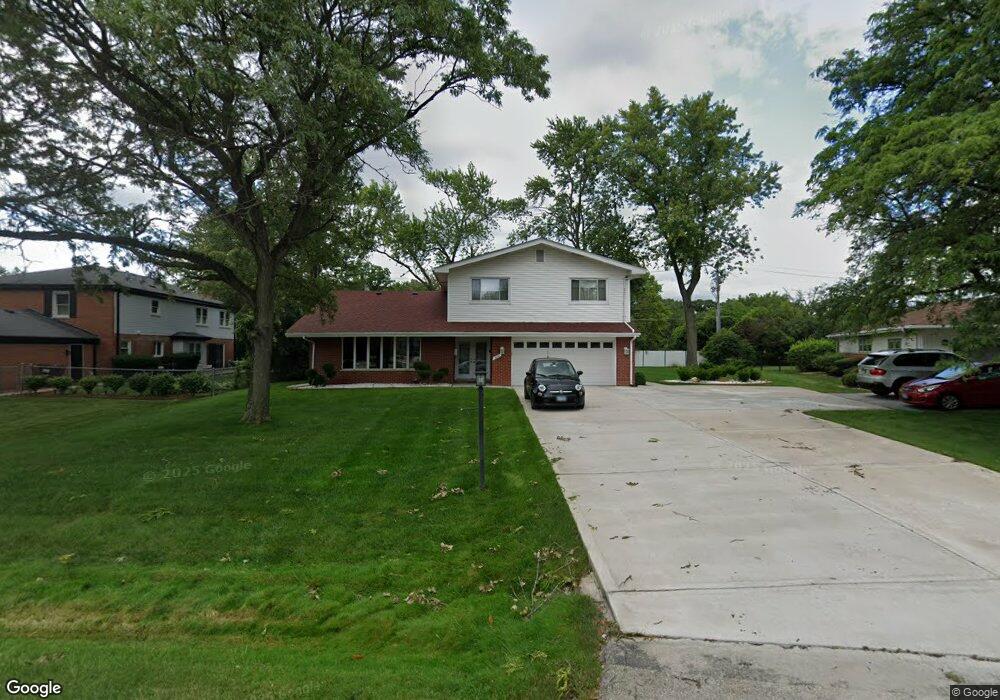
3650 Parthenon Way Olympia Fields, IL 60461
Estimated Value: $129,000 - $175,000
4
Beds
2
Baths
1,755
Sq Ft
$90/Sq Ft
Est. Value
About This Home
This home is located at 3650 Parthenon Way, Olympia Fields, IL 60461 and is currently estimated at $158,083, approximately $90 per square foot. 3650 Parthenon Way is a home located in Cook County with nearby schools including Illinois School, Arcadia Elementary School, and Indiana Elementary School.
Ownership History
Date
Name
Owned For
Owner Type
Purchase Details
Closed on
Jun 13, 2024
Sold by
Pittman Tyrone
Bought by
Chicago Title Land Trust
Current Estimated Value
Purchase Details
Closed on
Mar 23, 2005
Sold by
Chicago Title Land Trust Co
Bought by
Pittman Tyrone
Home Financials for this Owner
Home Financials are based on the most recent Mortgage that was taken out on this home.
Original Mortgage
$133,000
Interest Rate
6.06%
Mortgage Type
Fannie Mae Freddie Mac
Purchase Details
Closed on
May 24, 2004
Sold by
Pittman Tyrone
Bought by
Chicago Title Land Trust Co and Trust #1113132
Purchase Details
Closed on
Jun 27, 2001
Sold by
Richards Willis
Bought by
Pittman Tyrone
Home Financials for this Owner
Home Financials are based on the most recent Mortgage that was taken out on this home.
Original Mortgage
$78,000
Interest Rate
7.2%
Mortgage Type
Purchase Money Mortgage
Purchase Details
Closed on
Mar 4, 2000
Sold by
Richards Willis
Bought by
Richards Willis and Trust #1
Create a Home Valuation Report for This Property
The Home Valuation Report is an in-depth analysis detailing your home's value as well as a comparison with similar homes in the area
Home Values in the Area
Average Home Value in this Area
Purchase History
| Date | Buyer | Sale Price | Title Company |
|---|---|---|---|
| Chicago Title Land Trust | -- | Chicago Title | |
| Pittman Tyrone | -- | Protect 1 Title Inc | |
| Chicago Title Land Trust Co | -- | Cti | |
| Pittman Tyrone | $130,000 | -- | |
| Richards Willis | -- | -- |
Source: Public Records
Mortgage History
| Date | Status | Borrower | Loan Amount |
|---|---|---|---|
| Previous Owner | Pittman Tyrone | $133,000 | |
| Previous Owner | Pittman Tyrone | $78,000 |
Source: Public Records
Tax History Compared to Growth
Tax History
| Year | Tax Paid | Tax Assessment Tax Assessment Total Assessment is a certain percentage of the fair market value that is determined by local assessors to be the total taxable value of land and additions on the property. | Land | Improvement |
|---|---|---|---|---|
| 2024 | $3,549 | $5,543 | $1,085 | $4,458 |
| 2023 | $4,411 | $5,543 | $1,085 | $4,458 |
| 2022 | $4,411 | $5,096 | $930 | $4,166 |
| 2021 | $4,288 | $5,095 | $930 | $4,165 |
| 2020 | $4,020 | $5,095 | $930 | $4,165 |
| 2019 | $4,344 | $5,555 | $852 | $4,703 |
| 2018 | $4,228 | $5,555 | $852 | $4,703 |
| 2017 | $4,090 | $5,555 | $852 | $4,703 |
| 2016 | $3,268 | $4,835 | $775 | $4,060 |
| 2015 | $3,170 | $4,835 | $775 | $4,060 |
| 2014 | $3,131 | $4,835 | $775 | $4,060 |
| 2013 | $3,105 | $5,257 | $775 | $4,482 |
Source: Public Records
Map
Nearby Homes
- 20601 Parthenon Way
- 20920 Governors Hwy
- 20535 Marathon Ct
- 20534 Arcadian Dr
- 20852 Greenwood Dr
- 20436 Arcadian Dr
- 20415 Doria Ln
- 820 Exmoor Rd
- 20626 Greenwood Dr
- 20520 Crawford Ave
- 3506 Ithaca Rd
- 831 Violet Ln
- 706 Carnation Ln
- 3718 211th Place
- 3420 203rd St
- 4108 Applewood Ln
- 20340 Crawford Ave
- 4110 Applewood Ln
- 21142 Locust St
- 21209 Oak St
- 3650 Parthenon Way
- 3650 Parthenon Way
- 3644 Parthenon Way
- 3700 Parthenon Way
- 3708 Parthenon Way
- 3701 Parthenon Way
- 1 Strauss Ln
- 3632 Parthenon Way
- 20700 Oak Lane Dr
- 3631 Parthenon Way
- 20613 Parthenon Way
- 20612 Marathon Ct
- 2 Strauss Ln
- 5 Strauss Ln
- 3624 Parthenon Way
- 20620 Parthenon Way
- 20700 Oak Ln
- 1 Danube Way
- 6 Strauss Ln
- 20609 Marathon Ct