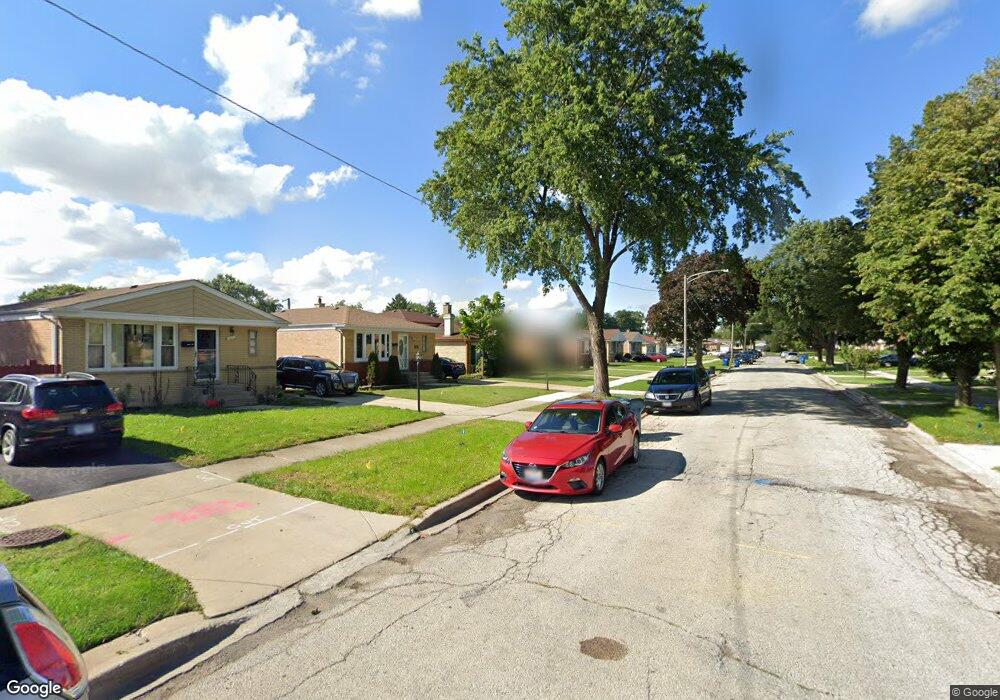
3650 Sarah St Franklin Park, IL 60131
Estimated Value: $345,422 - $375,000
3
Beds
2
Baths
1,046
Sq Ft
$348/Sq Ft
Est. Value
About This Home
This home is located at 3650 Sarah St, Franklin Park, IL 60131 and is currently estimated at $363,606, approximately $347 per square foot. 3650 Sarah St is a home located in Cook County with nearby schools including John F Kennedy Elementary School, Washington Elementary School, and Lincoln Middle School.
Ownership History
Date
Name
Owned For
Owner Type
Purchase Details
Closed on
Jul 15, 2020
Sold by
Battista Joe V and Battista Consiglia
Bought by
Battista Giuseppe and Battista Michael
Current Estimated Value
Purchase Details
Closed on
Nov 12, 1998
Sold by
Caringella Erminio and Defrenza Carmela
Bought by
Battista Joe V and Battista Consiglia
Home Financials for this Owner
Home Financials are based on the most recent Mortgage that was taken out on this home.
Original Mortgage
$142,800
Outstanding Balance
$30,430
Interest Rate
6.59%
Estimated Equity
$333,176
Purchase Details
Closed on
Sep 22, 1995
Sold by
Burzynski Andrew J and Burzynski Regina
Bought by
Caringella Erminio and Defrenza Carmela
Home Financials for this Owner
Home Financials are based on the most recent Mortgage that was taken out on this home.
Original Mortgage
$106,000
Interest Rate
7.68%
Create a Home Valuation Report for This Property
The Home Valuation Report is an in-depth analysis detailing your home's value as well as a comparison with similar homes in the area
Home Values in the Area
Average Home Value in this Area
Purchase History
| Date | Buyer | Sale Price | Title Company |
|---|---|---|---|
| Battista Giuseppe | -- | Chicago Title | |
| Battista Joe V | $168,000 | Chicago Title Insurance Co | |
| Caringella Erminio | $132,500 | -- |
Source: Public Records
Mortgage History
| Date | Status | Borrower | Loan Amount |
|---|---|---|---|
| Open | Battista Joe V | $142,800 | |
| Previous Owner | Caringella Erminio | $106,000 |
Source: Public Records
Tax History Compared to Growth
Tax History
| Year | Tax Paid | Tax Assessment Tax Assessment Total Assessment is a certain percentage of the fair market value that is determined by local assessors to be the total taxable value of land and additions on the property. | Land | Improvement |
|---|---|---|---|---|
| 2024 | $2,943 | $28,000 | $4,514 | $23,486 |
| 2023 | $3,022 | $28,000 | $4,514 | $23,486 |
| 2022 | $3,022 | $28,000 | $4,514 | $23,486 |
| 2021 | $3,542 | $17,944 | $3,260 | $14,684 |
| 2020 | $3,207 | $17,944 | $3,260 | $14,684 |
| 2019 | $3,102 | $20,276 | $3,260 | $17,016 |
| 2018 | $3,541 | $20,070 | $2,758 | $17,312 |
| 2017 | $3,476 | $20,070 | $2,758 | $17,312 |
| 2016 | $4,179 | $20,070 | $2,758 | $17,312 |
| 2015 | $4,645 | $17,976 | $2,508 | $15,468 |
| 2014 | $4,513 | $17,976 | $2,508 | $15,468 |
| 2013 | $3,803 | $17,976 | $2,508 | $15,468 |
Source: Public Records
Map
Nearby Homes
- 3639 Dora St
- 3535 Ernst St
- 3522 George St
- 10330 Addison Ave
- 3519 Louis St
- 3515 Louis St
- 10345 Mcnerney Dr
- 3507 Louis St
- 3652 Hawthorne St
- 3421 Sunset Ln
- 4001 Denley Ave
- 3709 Emerson St
- 3421 Elder Ln
- 3821 Emerson Dr
- 3706 Ruby St
- 4034 Denley Ave
- 9770 Ivanhoe Ave
- 3506 Lonnquist Dr
- 3137 Sunset Ln
- 3321 Ruby St