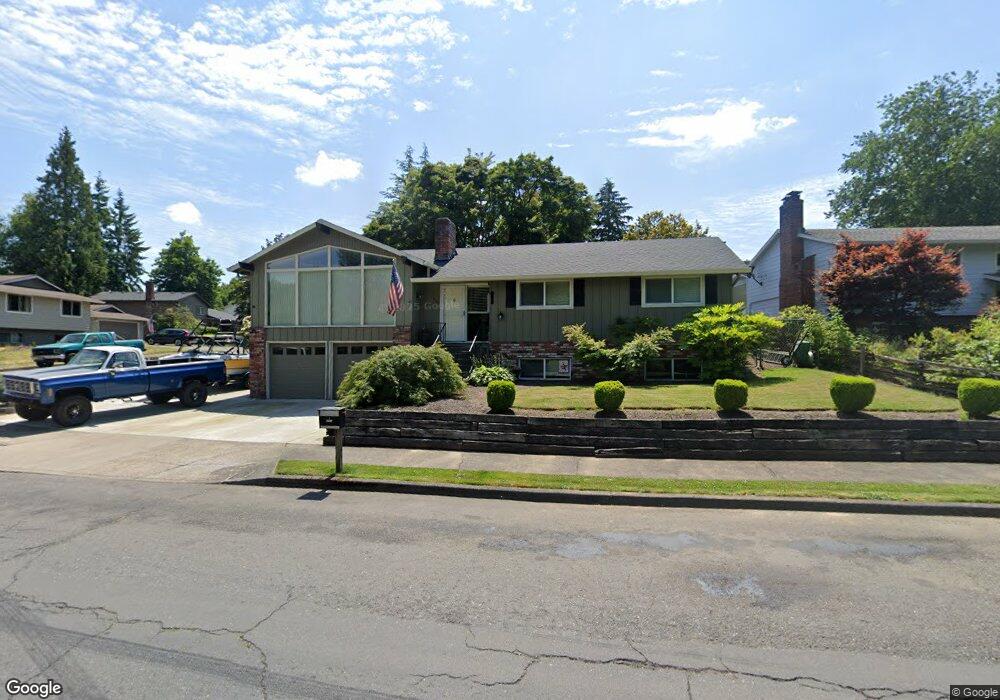
3650 SE 1st St Gresham, OR 97080
Powell Valley NeighborhoodEstimated Value: $509,000 - $557,000
3
Beds
3
Baths
2,350
Sq Ft
$228/Sq Ft
Est. Value
About This Home
This home is located at 3650 SE 1st St, Gresham, OR 97080 and is currently estimated at $534,634, approximately $227 per square foot. 3650 SE 1st St is a home located in Multnomah County with nearby schools including Powell Valley Elementary School, Gordon Russell Middle School, and Sam Barlow High School.
Ownership History
Date
Name
Owned For
Owner Type
Purchase Details
Closed on
Aug 16, 2019
Sold by
Alley Jason P and Alley Jo Ann
Bought by
Alley Jason P and Alley Jo Ann R
Current Estimated Value
Home Financials for this Owner
Home Financials are based on the most recent Mortgage that was taken out on this home.
Original Mortgage
$250,000
Outstanding Balance
$231,423
Interest Rate
7.5%
Mortgage Type
Adjustable Rate Mortgage/ARM
Estimated Equity
$303,211
Purchase Details
Closed on
Jul 29, 2004
Sold by
Alley Jason P
Bought by
Alley Jason P and Taylor Jo Ann R
Purchase Details
Closed on
Sep 11, 2003
Sold by
Property Quest Llc
Bought by
Alley Jason P
Home Financials for this Owner
Home Financials are based on the most recent Mortgage that was taken out on this home.
Original Mortgage
$184,110
Interest Rate
6.06%
Mortgage Type
FHA
Purchase Details
Closed on
Jan 12, 1995
Sold by
Alcalde Albert
Bought by
Alcalde Lori
Create a Home Valuation Report for This Property
The Home Valuation Report is an in-depth analysis detailing your home's value as well as a comparison with similar homes in the area
Home Values in the Area
Average Home Value in this Area
Purchase History
| Date | Buyer | Sale Price | Title Company |
|---|---|---|---|
| Alley Jason P | -- | Wfg Title | |
| Alley Jason P | -- | Transnation | |
| Alley Jason P | $187,000 | Transnation | |
| Alcalde Lori | -- | Fidelity National Title |
Source: Public Records
Mortgage History
| Date | Status | Borrower | Loan Amount |
|---|---|---|---|
| Open | Alley Jason P | $250,000 | |
| Previous Owner | Alley Jason P | $184,110 |
Source: Public Records
Tax History
| Year | Tax Paid | Tax Assessment Tax Assessment Total Assessment is a certain percentage of the fair market value that is determined by local assessors to be the total taxable value of land and additions on the property. | Land | Improvement |
|---|---|---|---|---|
| 2025 | $5,585 | $274,460 | -- | -- |
| 2024 | $5,346 | $266,470 | -- | -- |
| 2023 | $4,871 | $258,710 | $0 | $0 |
| 2022 | $4,735 | $251,180 | $0 | $0 |
| 2021 | $4,616 | $243,870 | $0 | $0 |
| 2020 | $4,343 | $236,770 | $0 | $0 |
| 2019 | $4,360 | $229,880 | $0 | $0 |
| 2018 | $4,033 | $223,190 | $0 | $0 |
| 2017 | $3,869 | $216,690 | $0 | $0 |
| 2016 | $3,411 | $210,380 | $0 | $0 |
| 2015 | $3,338 | $204,260 | $0 | $0 |
| 2014 | $3,256 | $198,320 | $0 | $0 |
Source: Public Records
Map
Nearby Homes
- 3545 SE 1st St
- 64 NE Scott Dr
- 205 SE Olvera Ave
- 4545 SE 3rd St
- 275 NE Scott Dr
- 3825 NE 2nd St
- 4668 SE 2nd St
- 4636 SE 2nd St
- 4690 SE 2nd St
- 180 NE Kane Dr Unit 180
- 377 SE Barnes Ave
- 3454 NE 5th Ct
- 4111 NE 3rd St
- 150 NE Greenway Dr
- 4343 NE 1st St
- 4396 SE 1st Terrace
- 389 SE Palmblad Dr
- 3105 SE Powell Valley Rd
- 685 NE Paloma Ave
- 0 SE Powell Valley Rd Unit 257585008
- 3640 SE 1st St
- 3645 SE El Camino Dr
- 3640 SE El Camino Dr
- 3610 SE 1st St
- 220 SE Hacienda Ct
- 3630 SE El Camino Dr
- 3680 SE El Camino Dr
- 180 SE Hacienda Ct
- 3590 SE 1st St
- 3620 SE El Camino Dr
- 3595 SE 1st St
- 215 SE La Mesa Ct
- 3695 SE El Camino Dr
- 255 SE La Mesa Ct
- 175 SE Hacienda Ct
- 3552 SE 1st St
- 3600 SE El Camino Dr
- 285 SE Haciendarelisted
- 285 SE Hacienda Ct
- 215 SE Hacienda Ct
Your Personal Tour Guide
Ask me questions while you tour the home.