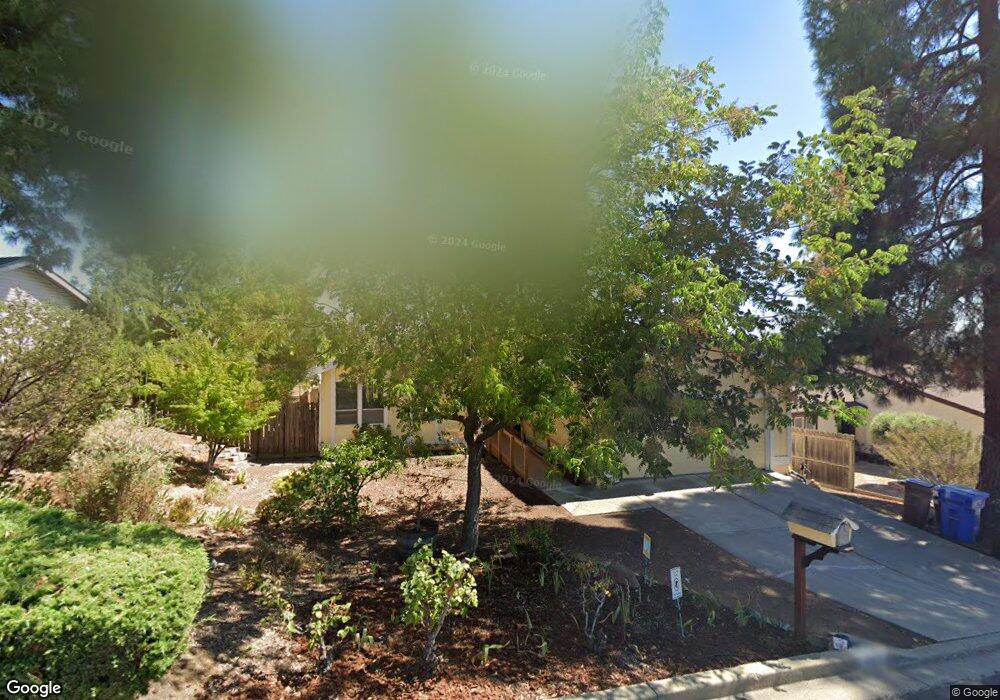
3651 Sun View Ct Concord, CA 94520
Sun Terrace NeighborhoodEstimated Value: $719,000 - $833,000
3
Beds
2
Baths
1,436
Sq Ft
$535/Sq Ft
Est. Value
About This Home
This home is located at 3651 Sun View Ct, Concord, CA 94520 and is currently estimated at $767,784, approximately $534 per square foot. 3651 Sun View Ct is a home located in Contra Costa County with nearby schools including Sun Terrace Elementary School, El Dorado Middle School, and Mt. Diablo High School.
Ownership History
Date
Name
Owned For
Owner Type
Purchase Details
Closed on
Jan 28, 2025
Sold by
Marshall Allison Justin and Marshall Nicole Crowther
Bought by
Campos-Salas Miguel Angel and Mar Helen Man
Current Estimated Value
Home Financials for this Owner
Home Financials are based on the most recent Mortgage that was taken out on this home.
Original Mortgage
$518,100
Outstanding Balance
$514,906
Interest Rate
6.72%
Mortgage Type
New Conventional
Estimated Equity
$252,878
Purchase Details
Closed on
Mar 8, 2023
Sold by
Elinor J Rogers Trust
Bought by
Allison Justin Marshall and Crowther Laura Nicole
Home Financials for this Owner
Home Financials are based on the most recent Mortgage that was taken out on this home.
Original Mortgage
$697,500
Interest Rate
6.09%
Mortgage Type
New Conventional
Purchase Details
Closed on
Jan 11, 2013
Sold by
Rogers Elinor J
Bought by
Rogers Elinor J
Purchase Details
Closed on
Dec 13, 2000
Sold by
Rogers Paul J and Rogers Elinor J
Bought by
Rogers Paul J and Rogers Elinor J
Create a Home Valuation Report for This Property
The Home Valuation Report is an in-depth analysis detailing your home's value as well as a comparison with similar homes in the area
Home Values in the Area
Average Home Value in this Area
Purchase History
We collect this data history from publicly available records. To have your information removed, we recommend requesting removal directly through your county’s website.
| Date | Buyer | Sale Price | Title Company |
|---|---|---|---|
| Campos-Salas Miguel Angel | $785,000 | Fidelity National Title Compan | |
| Allison Justin Marshall | $775,000 | Chicago Title | |
| Rogers Elinor J | -- | None Available | |
| Rogers Paul J | -- | -- |
Source: Public Records
Mortgage History
We collect this data history from publicly available records. To have your information removed, we recommend requesting removal directly through your county’s website.
| Date | Status | Borrower | Loan Amount |
|---|---|---|---|
| Open | Campos-Salas Miguel Angel | $518,100 | |
| Previous Owner | Allison Justin Marshall | $697,500 |
Source: Public Records
Tax History
| Year | Tax Paid | Tax Assessment Tax Assessment Total Assessment is a certain percentage of the fair market value that is determined by local assessors to be the total taxable value of land and additions on the property. | Land | Improvement |
|---|---|---|---|---|
| 2025 | $9,910 | $806,310 | $468,180 | $338,130 |
| 2024 | $9,104 | $790,500 | $459,000 | $331,500 |
| 2023 | $9,104 | $740,000 | $500,000 | $240,000 |
| 2022 | $1,774 | $93,310 | $27,926 | $65,384 |
| 2021 | $1,707 | $91,481 | $27,379 | $64,102 |
| 2019 | $1,655 | $88,769 | $26,568 | $62,201 |
| 2018 | $1,575 | $87,030 | $26,048 | $60,982 |
| 2017 | $1,502 | $85,325 | $25,538 | $59,787 |
| 2016 | $1,493 | $83,653 | $25,038 | $58,615 |
| 2015 | $1,372 | $82,397 | $24,662 | $57,735 |
| 2014 | $1,312 | $80,784 | $24,179 | $56,605 |
Source: Public Records
Map
Nearby Homes
- 2332 Saint George Dr
- 2313 Panoramic Dr
- 2279 Saint George Dr
- 2442 Cardinal Ct
- 3585 Esperanza Dr
- 3922 Bayview Cir
- 3706 Edmonton Way
- 2206 Toronto Ln
- 3453 Thunderbird Dr
- 3485 Hillsborough Dr
- 3436 Thunderbird Dr
- 3367 Benton St
- 3430 Sanford St
- 3715 Northwood Dr Unit G
- 3355 Bennett Way
- 3335 Northwood Dr Unit C
- 2261 Gehringer Dr
- 2159 Dalis Dr Unit 106
- 2219 Acacia Dr
- 2287 Dalis Dr Unit 169
- 3651 Sunview Ct
- 3631 Sunview Ct
- 3671 Sunview Ct
- 3621 Sunview Ct
- 3650 Sunview Ct
- 3670 Sunview Ct
- 3691 Sunview Ct
- 2490 Sunview Place
- 3611 Sunview Ct
- 3690 Sunview Ct
- 3655 Sunview Way
- 3651 Sunview Way
- 3651 Sun View Way
- 2637 Wellinton Ct
- 2474 Sunview Place
- 3661 Sunview Way
- 3601 Sunview Ct
- 2491 Sunview Terrace
- 2460 Sunview Place
- 2491 Sun View Terrace
Your Personal Tour Guide
Ask me questions while you tour the home.