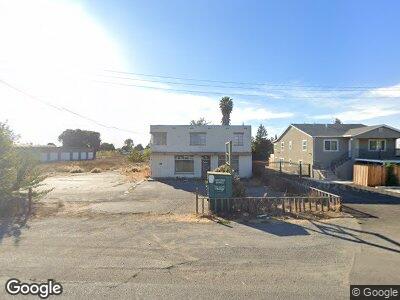
3657 Broadway St American Canyon, CA 94503
Estimated Value: $1,088,811
--
Bed
--
Bath
102,802
Sq Ft
$11/Sq Ft
Est. Value
About This Home
This home is located at 3657 Broadway St, American Canyon, CA 94503 and is currently estimated at $1,088,811, approximately $10 per square foot. 3657 Broadway St is a home located in Napa County with nearby schools including Napa Junction Elementary School, American Canyon Middle School, and American Canyon High School.
Ownership History
Date
Name
Owned For
Owner Type
Purchase Details
Closed on
Dec 21, 2023
Sold by
Osman Sina
Bought by
Ishaq Osman
Current Estimated Value
Home Financials for this Owner
Home Financials are based on the most recent Mortgage that was taken out on this home.
Original Mortgage
$350,000
Outstanding Balance
$137,246
Interest Rate
7.29%
Mortgage Type
Construction
Estimated Equity
$951,565
Purchase Details
Closed on
Oct 17, 2019
Sold by
Leung Richard Yf and Yu Jenny
Bought by
Osman Ishaq and Osman Sina
Purchase Details
Closed on
Jun 14, 2015
Sold by
Leung Richard Y F and Yu Jenny
Bought by
The Leung Yu Family Trust
Purchase Details
Closed on
Mar 27, 2014
Sold by
Slaughter Colleen
Bought by
Leung Richard Yf and Yu Jenny H
Purchase Details
Closed on
Apr 18, 1997
Sold by
Williams Thomas B
Bought by
Williams Larry D
Create a Home Valuation Report for This Property
The Home Valuation Report is an in-depth analysis detailing your home's value as well as a comparison with similar homes in the area
Home Values in the Area
Average Home Value in this Area
Purchase History
| Date | Buyer | Sale Price | Title Company |
|---|---|---|---|
| Ishaq Osman | -- | Chicago Title Company | |
| Osman Ishaq | $780,000 | Old Republic Title Company | |
| The Leung Yu Family Trust | -- | None Available | |
| Leung Richard Yf | $655,000 | North American Title Co Inc | |
| Williams Larry D | -- | -- |
Source: Public Records
Mortgage History
| Date | Status | Borrower | Loan Amount |
|---|---|---|---|
| Open | Ishaq Osman | $350,000 |
Source: Public Records
Tax History Compared to Growth
Tax History
| Year | Tax Paid | Tax Assessment Tax Assessment Total Assessment is a certain percentage of the fair market value that is determined by local assessors to be the total taxable value of land and additions on the property. | Land | Improvement |
|---|---|---|---|---|
| 2023 | $8,505 | $736,000 | $662,000 | $74,000 |
| 2022 | $8,123 | $700,000 | $630,000 | $70,000 |
| 2021 | $8,143 | $700,000 | $630,000 | $70,000 |
| 2020 | $9,032 | $780,000 | $700,000 | $80,000 |
| 2019 | $8,366 | $719,786 | $620,886 | $98,900 |
| 2018 | $8,284 | $705,673 | $608,712 | $96,961 |
| 2017 | $8,063 | $691,837 | $596,777 | $95,060 |
| 2016 | $8,063 | $678,273 | $585,076 | $93,197 |
| 2015 | -- | $668,086 | $576,288 | $91,798 |
| 2014 | -- | $728,290 | $637,882 | $90,408 |
Source: Public Records
Map
Nearby Homes
- 0 Melvin Rd Unit 324032405
- 0 Melvin Rd Unit 324032406
- 3885 Broadway
- 259 Los Altos Place
- 204 Los Altos Place
- 219 Rio Del Mar
- 221 Rio Del Mar
- 10 Flamingo Ct
- 130 Eucalyptus Dr
- 59 Toscana Dr
- 146 Goldback St
- 185 Goldback St
- 272 Hummingbird Way
- 3000 St Unit 92
- 3000 Broadway St Unit 62
- 330 Brookshire Ct
- 105 Red Clover Way
- 260 American Canyon Rd Unit 13
- 0 Eucalyptus Dr Unit 325027507
- 0 Eucalyptus Dr Unit 325028557