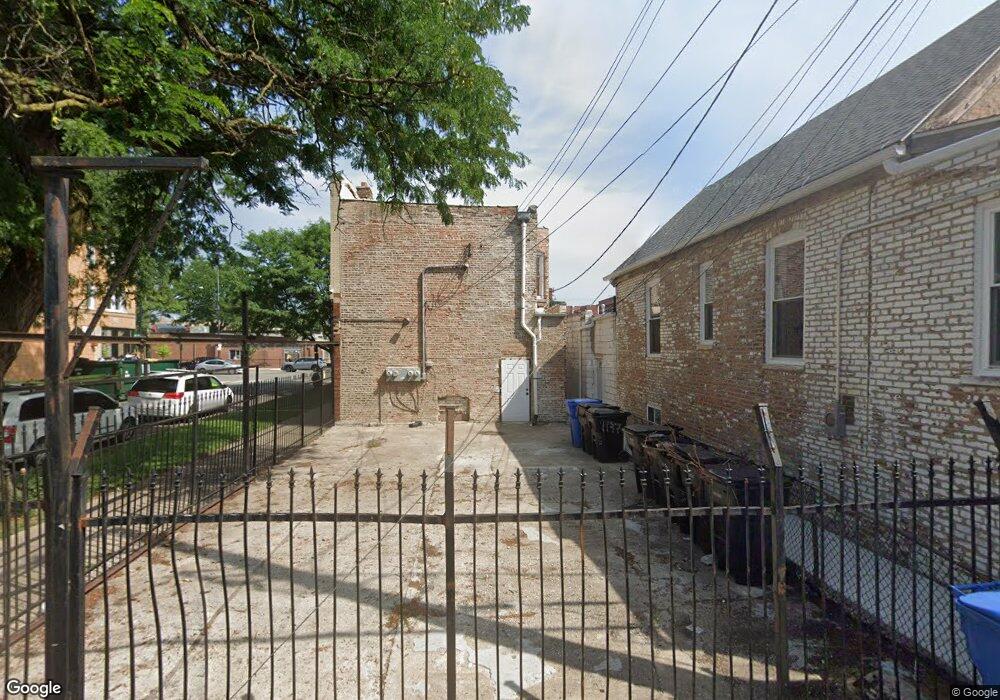
3659 W Division St Chicago, IL 60651
Humboldt Park NeighborhoodEstimated Value: $343,070 - $464,000
6
Beds
7
Baths
3,840
Sq Ft
$105/Sq Ft
Est. Value
About This Home
This home is located at 3659 W Division St, Chicago, IL 60651 and is currently estimated at $403,535, approximately $105 per square foot. 3659 W Division St is a home located in Cook County with nearby schools including Cameron Elementary School, Orr Academy High School, and The Field School.
Ownership History
Date
Name
Owned For
Owner Type
Purchase Details
Closed on
Apr 12, 2016
Sold by
Chicago Assetg Mangemtn Llc
Bought by
Horbic Ryszard
Current Estimated Value
Purchase Details
Closed on
Apr 7, 2015
Sold by
Rozon Agustin
Bought by
Chicago Asset Management Llc
Purchase Details
Closed on
Nov 2, 2006
Sold by
Rozon Agustin
Bought by
Rozon Augustin and Arana Luz
Purchase Details
Closed on
Oct 5, 2006
Sold by
Rozon Agustin
Bought by
Rozon Augustin and Arana Luz
Purchase Details
Closed on
May 30, 2006
Sold by
Camacho Ismael
Bought by
Rozon Agustin
Home Financials for this Owner
Home Financials are based on the most recent Mortgage that was taken out on this home.
Original Mortgage
$243,000
Interest Rate
8.25%
Mortgage Type
Commercial
Purchase Details
Closed on
Jun 27, 1995
Sold by
Cho Si Yoon and Cho Pil Sun
Bought by
Camacho Ismael
Home Financials for this Owner
Home Financials are based on the most recent Mortgage that was taken out on this home.
Original Mortgage
$39,000
Interest Rate
7.9%
Mortgage Type
Commercial
Create a Home Valuation Report for This Property
The Home Valuation Report is an in-depth analysis detailing your home's value as well as a comparison with similar homes in the area
Home Values in the Area
Average Home Value in this Area
Purchase History
| Date | Buyer | Sale Price | Title Company |
|---|---|---|---|
| Horbic Ryszard | $132,000 | None Available | |
| Chicago Asset Management Llc | -- | None Available | |
| Rozon Augustin | -- | None Available | |
| Rozon Augustin | -- | None Available | |
| Rozon Agustin | $325,000 | Attorneys Title Guaranty Fun | |
| Camacho Ismael | $89,000 | -- |
Source: Public Records
Mortgage History
| Date | Status | Borrower | Loan Amount |
|---|---|---|---|
| Previous Owner | Rozon Agustin | $243,000 | |
| Previous Owner | Camacho Ismael | $39,000 |
Source: Public Records
Tax History Compared to Growth
Tax History
| Year | Tax Paid | Tax Assessment Tax Assessment Total Assessment is a certain percentage of the fair market value that is determined by local assessors to be the total taxable value of land and additions on the property. | Land | Improvement |
|---|---|---|---|---|
| 2024 | $2,045 | $26,632 | $5,665 | $20,967 |
| 2023 | $1,987 | $9,662 | $4,593 | $5,069 |
| 2022 | $1,987 | $9,662 | $4,593 | $5,069 |
| 2021 | $1,943 | $9,662 | $4,593 | $5,069 |
| 2020 | $2,558 | $11,484 | $3,597 | $7,887 |
| 2019 | $2,652 | $13,200 | $3,597 | $9,603 |
| 2018 | $2,607 | $13,200 | $3,597 | $9,603 |
| 2017 | $4,961 | $23,044 | $3,215 | $19,829 |
| 2016 | $4,615 | $23,044 | $3,215 | $19,829 |
| 2015 | $4,223 | $23,044 | $3,215 | $19,829 |
| 2014 | $4,139 | $22,310 | $3,062 | $19,248 |
| 2013 | $4,058 | $22,310 | $3,062 | $19,248 |
Source: Public Records
Map
Nearby Homes
- 1132 N Lawndale Ave
- 3739 W Division St
- 1205 N Hamlin Ave
- 1048 N Lawndale Ave
- 3709 W Potomac Ave
- 1041 N Ridgeway Ave
- 1030 N Lawndale Ave
- 1106 N Hamlin Ave
- 1350 N Monticello Ave
- 1349 N Ridgeway Ave
- 1348 N Hamlin Ave
- 1051 N Springfield Ave
- 1110 N Springfield Ave
- 932 N Monticello Ave
- 931 N Lawndale Ave
- 3518 W Augusta Blvd
- 943 N Central Park Ave
- 1141 N Harding Ave
- 3523 W Hirsch St
- 1005 N Springfield Ave
- 3659 W Division St
- 3655 W Division St
- 3649 W Division St
- 1152 N Lawndale Ave Unit 3
- 1152 N Lawndale Ave Unit 1
- 1152 N Lawndale Ave Unit 2
- 1154 N Lawndale Ave Unit 3
- 1154 N Lawndale Ave Unit 1
- 1154 N Lawndale Ave Unit 2
- 3705 W Division St Unit 2
- 3705 W Division St Unit 3
- 3647 W Division St
- 1141 N Lawndale Ave
- 3703 W Division St Unit 1
- 3703 W Division St Unit 2
- 3701 W Division St Unit 1
- 3701 W Division St Unit 2
- 1142 N Lawndale Ave
- 1142 N Lawndale Ave