366 Patsy St Porterville, CA 93257
Porterville Northwest NeighborhoodEstimated Value: $197,000 - $276,000
Studio
--
Bath
1,136
Sq Ft
$210/Sq Ft
Est. Value
About This Home
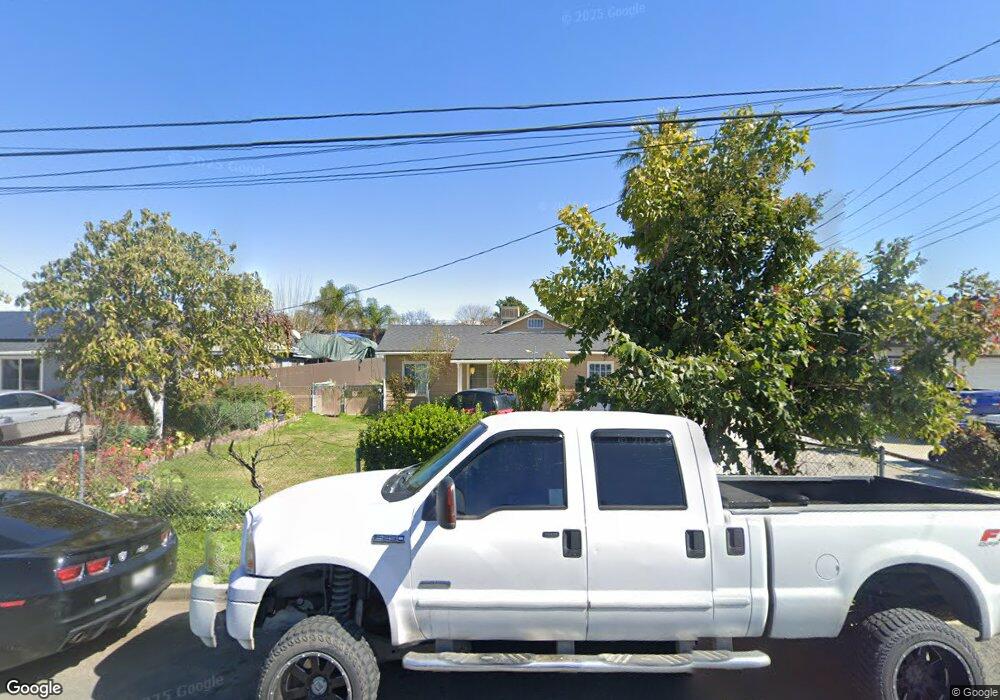
This home is located at 366 Patsy St, Porterville, CA 93257 and is currently estimated at $238,008, approximately $209 per square foot. 366 Patsy St is a home located in Tulare County with nearby schools including Burton Elementary School, Burton Middle School, and Porterville High School.
Ownership History
Date
Name
Owned For
Owner Type
Purchase Details
Closed on
Dec 23, 2010
Sold by
Zavala Rogelio
Bought by
Ceballos Juana
Current Estimated Value
Home Financials for this Owner
Home Financials are based on the most recent Mortgage that was taken out on this home.
Original Mortgage
$66,276
Interest Rate
4.5%
Mortgage Type
FHA
Purchase Details
Closed on
Jun 3, 1996
Sold by
Zavala Rita
Bought by
Zavala Rogelio
Home Financials for this Owner
Home Financials are based on the most recent Mortgage that was taken out on this home.
Original Mortgage
$62,050
Interest Rate
8.3%
Purchase Details
Closed on
Sep 21, 1995
Sold by
Jewett Lucy
Bought by
Jewett Timothy M and Salcido Mike
Home Financials for this Owner
Home Financials are based on the most recent Mortgage that was taken out on this home.
Original Mortgage
$11,855
Interest Rate
7.88%
Create a Home Valuation Report for This Property
The Home Valuation Report is an in-depth analysis detailing your home's value as well as a comparison with similar homes in the area
Home Values in the Area
Average Home Value in this Area
Purchase History
| Date | Buyer | Sale Price | Title Company |
|---|---|---|---|
| Ceballos Juana | $68,000 | None Available | |
| Zavala Rogelio | -- | Fidelity National Title Co | |
| Zavala Rogelio | $64,000 | Fidelity National Title Co | |
| Jewett Timothy M | -- | -- |
Source: Public Records
Mortgage History
| Date | Status | Borrower | Loan Amount |
|---|---|---|---|
| Previous Owner | Ceballos Juana | $66,276 | |
| Previous Owner | Zavala Rogelio | $62,050 | |
| Previous Owner | Jewett Timothy M | $11,855 |
Source: Public Records
Tax History
| Year | Tax Paid | Tax Assessment Tax Assessment Total Assessment is a certain percentage of the fair market value that is determined by local assessors to be the total taxable value of land and additions on the property. | Land | Improvement |
|---|---|---|---|---|
| 2025 | $1,105 | $87,118 | $19,217 | $67,901 |
| 2024 | $1,105 | $85,411 | $18,841 | $66,570 |
| 2023 | $1,107 | $83,737 | $18,472 | $65,265 |
| 2022 | $1,056 | $82,096 | $18,110 | $63,986 |
| 2021 | $1,058 | $80,486 | $17,755 | $62,731 |
| 2020 | $1,042 | $79,661 | $17,573 | $62,088 |
| 2019 | $1,042 | $78,099 | $17,228 | $60,871 |
| 2018 | $1,004 | $76,567 | $16,890 | $59,677 |
| 2017 | $991 | $75,066 | $16,559 | $58,507 |
| 2016 | $953 | $73,594 | $16,234 | $57,360 |
| 2015 | $926 | $72,488 | $15,990 | $56,498 |
| 2014 | $926 | $71,068 | $15,677 | $55,391 |
Source: Public Records
Map
Nearby Homes
- 790 Rose Ln
- 1676 W Putnam Ave
- 480 N Belmont St
- 1690 W Kanai Ave
- 595 N Salisbury St
- 1343 W Morton Ave Unit Sp 84
- 635 N Belmont St
- 72 S Newcomb St
- 334 N Argyle St
- 1147 W Putnam Ave
- 1137 W Putnam Ave
- 1942 W Date Ave
- 2179 W Della Ave
- 640 N Prospect St
- 474 Douglas St
- 1087 W Belleview Ave
- 700 N Prospect St
- 1692 S Beverly St
- 0 W Morton Unit 234694
- 331 N Capitola Ct Unit 3
Your Personal Tour Guide
Ask me questions while you tour the home.