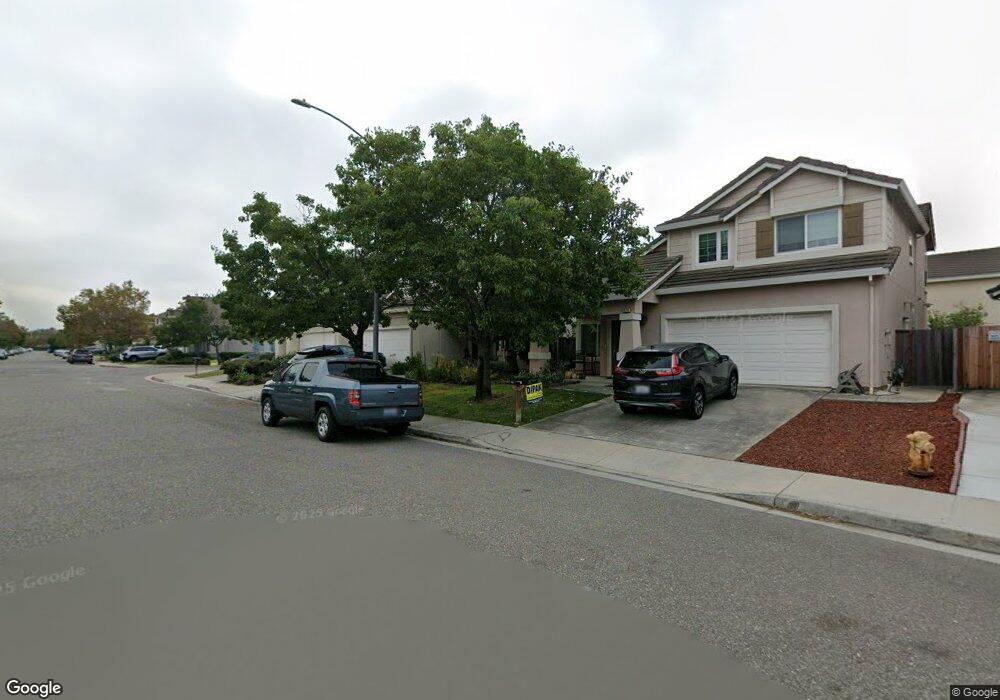
366 Summerfield Dr Milpitas, CA 95035
Estimated Value: $1,811,000 - $2,356,000
4
Beds
3
Baths
2,316
Sq Ft
$893/Sq Ft
Est. Value
About This Home
This home is located at 366 Summerfield Dr, Milpitas, CA 95035 and is currently estimated at $2,067,178, approximately $892 per square foot. 366 Summerfield Dr is a home located in Santa Clara County with nearby schools including Pearl Zanker Elementary School, Rancho Milpitas Middle School, and Milpitas High School.
Ownership History
Date
Name
Owned For
Owner Type
Purchase Details
Closed on
Oct 5, 2017
Sold by
Talukdar Hasanul Kabir and Afroz Farhana
Bought by
Talukdar Md Hasanul Kabir and Afroz Farhana
Current Estimated Value
Purchase Details
Closed on
Feb 19, 2010
Sold by
Hoang Danny and Tran Christine
Bought by
Talukdar Md Hasanul Kabir and Afroz Farhana
Home Financials for this Owner
Home Financials are based on the most recent Mortgage that was taken out on this home.
Original Mortgage
$624,000
Outstanding Balance
$411,741
Interest Rate
4.97%
Mortgage Type
New Conventional
Estimated Equity
$1,655,437
Purchase Details
Closed on
Apr 27, 1998
Sold by
Dkb Homes Llc
Bought by
Hoang Danny and Tran Christine
Home Financials for this Owner
Home Financials are based on the most recent Mortgage that was taken out on this home.
Original Mortgage
$326,200
Interest Rate
7.05%
Create a Home Valuation Report for This Property
The Home Valuation Report is an in-depth analysis detailing your home's value as well as a comparison with similar homes in the area
Home Values in the Area
Average Home Value in this Area
Purchase History
| Date | Buyer | Sale Price | Title Company |
|---|---|---|---|
| Talukdar Md Hasanul Kabir | -- | None Available | |
| Talukdar Md Hasanul Kabir | $780,000 | Stewart Title Of California | |
| Hoang Danny | $407,500 | First American Title Guarant |
Source: Public Records
Mortgage History
| Date | Status | Borrower | Loan Amount |
|---|---|---|---|
| Open | Talukdar Md Hasanul Kabir | $624,000 | |
| Previous Owner | Hoang Danny | $326,200 | |
| Closed | Hoang Danny | $40,700 |
Source: Public Records
Tax History
| Year | Tax Paid | Tax Assessment Tax Assessment Total Assessment is a certain percentage of the fair market value that is determined by local assessors to be the total taxable value of land and additions on the property. | Land | Improvement |
|---|---|---|---|---|
| 2025 | $11,550 | $1,006,825 | $553,755 | $453,070 |
| 2024 | $11,550 | $987,085 | $542,898 | $444,187 |
| 2023 | $11,514 | $967,731 | $532,253 | $435,478 |
| 2022 | $11,467 | $948,757 | $521,817 | $426,940 |
| 2021 | $11,301 | $930,155 | $511,586 | $418,569 |
| 2020 | $11,105 | $920,619 | $506,341 | $414,278 |
| 2019 | $10,978 | $902,568 | $496,413 | $406,155 |
| 2018 | $10,424 | $884,872 | $486,680 | $398,192 |
| 2017 | $10,290 | $867,523 | $477,138 | $390,385 |
| 2016 | $9,875 | $850,514 | $467,783 | $382,731 |
| 2015 | $9,776 | $837,740 | $460,757 | $376,983 |
| 2014 | $9,519 | $821,331 | $451,732 | $369,599 |
Source: Public Records
Map
Nearby Homes
- 1111 Stellar Way
- 800 S Abel St Unit 100
- 39 Cloud Walk Unit 328
- 59 Wind Song
- 969 Mente Linda Loop Unit 6G
- 690 Claridad Loop Unit 11E
- 678 S Main St
- 885 Spirit Walk Unit 243
- 45 Parc Place Dr Unit RU2808
- 660 S Main St
- 646 S Main St
- 1503 Canal St
- 839 Harmony Place Unit 126
- 353 San Miguel Ct Unit 2
- 295 Rio Verde Place Unit 4
- 27 S Main St
- 1864 Lee Way
- 287 Wild Rose Way
- 1310 Nestwood Way
- 275 Currlin Cir
- 376 Summerfield Dr
- 360 Summerfield Dr
- 991 Venus Way
- 382 Summerfield Dr
- 988 Summerfield Dr
- 999 Venus Way
- 996 Summerfield Dr
- 369 Summerfield Dr
- 373 Summerfield Dr
- 363 Summerfield Dr
- 381 Summerfield Dr
- 348 Summerfield Dr
- 387 Summerfield Dr
- 1002 Summerfield Dr
- 361 Summerfield Dr
- 1003 Venus Way
- 990 Venus Way
- 351 Summerfield Dr
- 342 Summerfield Dr
- 1008 Summerfield Dr
Your Personal Tour Guide
Ask me questions while you tour the home.